MetLife 2002 Annual Report Download - page 14
Download and view the complete annual report
Please find page 14 of the 2002 MetLife annual report below. You can navigate through the pages in the report by either clicking on the pages listed below, or by using the keyword search tool below to find specific information within the annual report.-
 1
1 -
2
-
3
-
 4
4 -
 5
5 -
 6
6 -
 7
7 -
 8
8 -
 9
9 -
 10
10 -
 11
11 -
 12
12 -
 13
13 -
 14
14 -
 15
15 -
 16
16 -
 17
17 -
 18
18 -
 19
19 -
 20
20 -
 21
21 -
 22
22 -
 23
23 -
 24
24 -
25
-
26
-
27
-
28
-
29
-
30
-
31
-
32
-
33
-
34
-
35
-
36
-
37
-
38
-
39
-
40
-
41
-
42
-
43
-
44
-
45
-
46
-
47
-
48
-
49
-
50
-
51
-
52
-
53
-
54
-
55
-
56
-
57
-
58
-
59
-
60
-
61
-
62
-
63
-
64
-
65
-
66
-
67
-
68
-
69
-
70
-
71
-
72
-
73
-
74
-
75
-
76
-
77
-
78
-
79
-
80
-
81
-
82
-
83
-
84
-
85
-
86
-
87
-
88
-
89
-
90
-
91
-
92
-
93
-
94
 |
 |
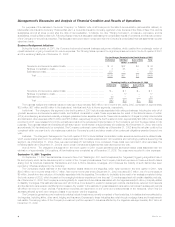
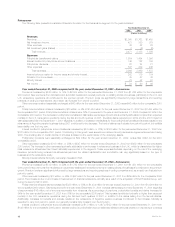
Income tax expense for the year ended December 31, 2002 was $516 million, or 31% of income from continuing operations before provision for
income taxes, compared with $227 million, or 37%, for the comparable 2001 period. The 2002 effective tax rate differs from the federal corporate tax rate
of 35% primarily due to the impact of non-taxable investment income. The 2001 effective tax rate differs from the federal corporate tax rate of 35%, due to
an increase in prior year income taxes on capital gains.
In accordance with SFAS No. 144, Accounting for the Impairment or Disposal of Long-Lived Assets (‘‘SFAS 144’’), income related to the Company’s
real estate which was identified as held-for-sale on or after January 1, 2002 is presented as discontinued operations for the years ended December 31,
2002, 2001 and 2000. The income from discontinued operations is comprised of net investment income and net investment gains related to
47 properties that the Company began marketing for sale on or after January 1, 2002. For the year ended December 31, 2002, the Company
recognized $582 million of net investment gains from discontinued operations due primarily to the sale of 36 properties.
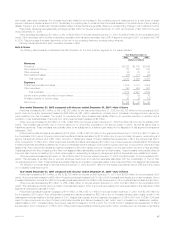
Year ended December 31, 2001 compared with the year ended December 31, 2000 — The Company
Premiums grew by $895 million, or 5%, to $17,212 million for the year ended December 31, 2001 from $16,317 for the comparable 2000 period.
This variance is attributable to increases in the Institutional, Reinsurance, International and Auto & Home segments, partially offset by a decrease in the
Individual segment. An improvement of $388 million in the Institutional segment is predominantly the result of sales growth and continued favorable
policyholder retention in this segment’s dental, disability and long-term care businesses. In addition, significant premiums received from several existing
group life customers in 2001 and the BMA acquisition in 2000 resulted in higher premiums. The 2000 balance includes $124 million in additional
insurance coverages purchased by existing customers with funds received in the demutualization and significant premiums received from existing
retirement and savings customers. New premiums from facultative and automatic treaties and renewal premiums on existing blocks of business all
contributed to the $312 million premium growth in the Reinsurance segment. A $186 million rise in the International segment is due to growth in Mexico,
South Korea, Spain and Taiwan, as well as acquisitions in Brazil and Chile. These variances were partially offset by a decline in Argentinean individual life
premiums, reflecting the impact of economic and political events in that country. Higher average premium resulting from rate increases is the primary
driver of a $119 million rise in the Auto & Home segment. A $110 million decline in the Individual segment is attributable to lower sales of traditional life
insurance policies, which reflects a continued shift in customer preference from those policies to variable life products.
Universal life and investment-type product policy fees increased by $69 million, or 4%, to $1,889 million for the year ended December 31, 2001
from $1,820 million for the comparable 2000 period. This variance is due to increases in the Institutional and Individual segments, partially offset by a
decline in the International segment. Growth in sales and deposits of group universal life and COLI products resulted in a $45 million increase in the
Institutional segment. A $39 million rise in the Individual segment is predominantly the result of higher fees from variable life products reflecting a shift in
customer preferences from traditional life products. A decrease of $15 million in the International segment is primarily due to reduced fees in Spain
resulting from fewer assets under management. This is a result of a planned cessation of product lines offered through a joint venture with Banco
Santander.
Net investment income increased by $231 million, or 2%, to $11,255 million for the year ended December 31, 2001 from $11,024 million for the
comparable 2000 period. This change is due to higher income from (i) mortgage loans on real estate of $155 million, or 9%, (ii) fixed maturities of
$116 million, or 1%, (iii) other invested assets of $87 million, or 54%, and (iv) interest income on policy loans of $21 million, or 4%. These positive
variances are partially offset by lower income from (i) equity securities and other limited partnership interests of $86 million, or 47%, (ii) real estate and real
estate joint ventures held-for-investment, net of investment expenses and depreciation, of $49 million, or 10%, (iii) cash, cash equivalents and short-term
investments of $9 million, or 3%, and (iv) higher investment expenses of $4 million, or 2%.
The increase in income from mortgage loans on real estate to $1,848 million in 2001 from $1,693 million in 2000 is predominantly the result of
higher mortgage production volume and increases in mortgage prepayment fees and contingent interest. The improvement in income from fixed
maturities to $8,031 million in 2001 from $7,915 million in 2000 is primarily due to bond prepayments and increased securities lending activity, offset by
lower yields on reinvestments. Income from other invested assets increased to $249 million in 2001 from $162 million in 2000 primarily due to the
reclassification of $19 million from other comprehensive income related to cash flow hedges, $24 million from derivatives not designated as accounting
hedges and the recognition in 2000 of a $20 million loss on an equity method investment. The increase in interest income from policy loans to
$536 million in 2001 from $515 million in 2000 is largely due to increased loans outstanding. The reduction of income from equity securities and other
limited partnership interests to $97 million in 2001 from $183 million in 2000 is primarily due to fewer sales of underlying assets held in corporate
partnerships and increased partnership write-downs. The decrease in income from real estate and real estate joint ventures held-for-investment to
$459 million in 2001 from $508 million in 2000 is primarily due to a decline in hotel occupancy rates and reduced real estate joint venture sales.
The increase in net investment income is largely attributable to positive variances in the Institutional and Individual segments, partially offset by a
decline in Corporate & Other. Net investment income for the Institutional and Individual segments grew by $254 million and $80 million, respectively.
These increases are predominately due to a higher volume of securities lending activity, increases in bond and mortgage prepayments and higher
contingent interest on mortgages. The decrease in Corporate & Other is principally the result of sales in 2000 of underlying assets held in corporate
limited partnerships. The remainder of the variance is attributable to smaller fluctuations in the other segments.
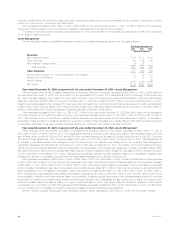
Other revenues decreased by $722 million, or 32%, to $1,507 million for the year ended December 31, 2001 from $2,229 million for the
comparable 2000 period. This variance is mainly attributable to reductions in the Asset Management, Individual and Auto & Home segments, partially
offset by an increase in the Reinsurance segment. The sales of Nvest and Conning in October 2000 and July 2001, respectively, are the primarily drivers
of a $562 million decline in the Asset Management segment. A decrease of $155 million in the Individual segment is primarily due to reduced commission
and fee income associated with lower sales in the broker/dealer and other subsidiaries which was a result of the equity market downturn. Such
commission and fee income can fluctuate consistent with movements in the equity market. Auto & Home’s other revenues are lower by $18 million
primarily due to a revision of an estimate made in 2000 of amounts recoverable from reinsurers related to the disposition of this segment’s reinsurance
business in 1990. Other revenues in the Reinsurance segment improved by $13 million due to an increase in fees earned on financial reinsurance,
primarily as a result of the acquisition of the remaining interest in RGA Financial Group, LLC during the second half of 2000.
The Company’s investment gains and losses are net of related policyholder amounts. The amounts netted against investment gains and losses are
(i) amortization of deferred policy acquisition costs, to the extent that such amortization results from investment gains and losses, (ii) additions to
participating contractholder accounts when amounts equal to such investment gains and losses are credited to the contractholder’s accounts, and
(iii) adjustments to the policyholder dividend obligation resulting from investment gains and losses.
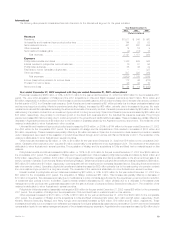
Net investment losses grew by $213 million, or 55%, to $603 million for the year ended December 31, 2001 from $390 million for the comparable
2000 period. This increase reflects total investment losses, before offsets, of $737 million, an increase of $293 million, or 66%, from $444 million in
2000. Offsets include the amortization of deferred policy acquisition costs of ($25) million and $95 million in 2001 and 2000, respectively; changes in
MetLife, Inc.
10