MetLife 2002 Annual Report Download - page 68
Download and view the complete annual report
Please find page 68 of the 2002 MetLife annual report below. You can navigate through the pages in the report by either clicking on the pages listed below, or by using the keyword search tool below to find specific information within the annual report.-
 1
1 -
2
-
3
-
4
-
5
-
6
-
7
-
8
-
9
-
10
-
11
-
12
-
13
-
14
-
15
-
16
-
17
-
18
-
19
-
20
-
21
-
22
-
23
-
24
-
25
-
26
-
27
-
28
-
29
-
30
-
31
-
32
-
33
-
34
-
35
-
36
-
37
-
38
-
39
-
40
-
41
-
42
-
43
-
44
-
45
-
46
-
47
-
48
-
49
-
50
-
51
-
52
-
53
-
54
-
55
-
56
-
57
-
 58
58 -
 59
59 -
 60
60 -
 61
61 -
 62
62 -
 63
63 -
 64
64 -
 65
65 -
 66
66 -
 67
67 -
 68
68 -
 69
69 -
 70
70 -
 71
71 -
 72
72 -
 73
73 -
 74
74 -
 75
75 -
 76
76 -
 77
77 -
 78
78 -
79
-
80
-
81
-
82
-
83
-
84
-
85
-
86
-
87
-
88
-
89
-
90
-
91
-
92
-
93
-
94
 |
 |

METLIFE, INC.
NOTES TO CONSOLIDATED FINANCIAL STATEMENTS — (Continued)
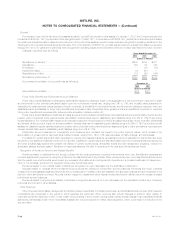
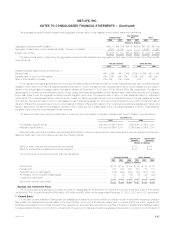
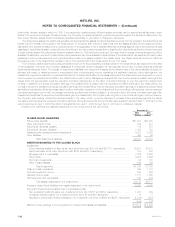
The following is a reconciliation of the notional amounts by derivative type and strategy at December 31, 2002 and 2001:
December 31, 2001 Terminations/ December 31, 2002
Notional Amount Additions Maturities Notional Amount
(Dollars in millions)
BY DERIVATIVE TYPE
Financial futures *************************************************** $ — $ 760 $ 756 $ 4
Interest rate swaps************************************************* 1,823 3,005 962 3,866
Floors************************************************************ 325 — — 325
Caps ************************************************************ 7,890 3,870 3,720 8,040
Financial forwards************************************************** — 2,945 1,000 1,945
Foreign currency swaps ******************************************** 1,925 760 314 2,371
Options ********************************************************** 1,880 55 1,857 78
Foreign currency forwards******************************************* 67 19 32 54
Written covered calls *********************************************** 40 — 40 —
Credit default swaps *********************************************** 270 121 15 376
Total contractual commitments *********************************** $14,220 $11,535 $8,696 $17,059
BY DERIVATIVE STRATEGY
Liability hedging *************************************************** $ 8,888 $ 3,937 $3,871 $ 8,954
Invested asset hedging ********************************************* 4,802 4,581 3,972 5,411
Portfolio hedging*************************************************** 530 2,104 — 2,634
Firm commitments and forecasted transactions ************************* — 913 853 60
Total contractual commitments *********************************** $14,220 $11,535 $8,696 $17,059
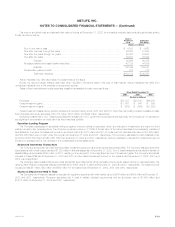
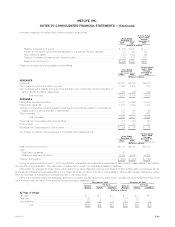
The following table presents the notional amounts of derivative financial instruments by maturity at December 31, 2002:
Remaining Life
After One After Five
One Year Year Through Years Through After Ten
or Less Five Years Ten Years Years Total
(Dollars in millions)
Financial futures ***************************************************** $4$ — $— $—$ 4
Interest rate swaps*************************************************** 64 1,887 1,630 285 3,866
Floors************************************************************** — — 325 — 325
Caps ************************************************************** 1,120 6,920 — — 8,040
Financial forwards**************************************************** 1,945 — — — 1,945
Foreign currency swaps ********************************************** 88 962 851 470 2,371
Options ************************************************************ 3 20 — 55 78
Foreign currency forwards********************************************* 53 1 — — 54
Written covered calls ************************************************* —— ———
Credit default swaps ************************************************* 45 331 — — 376
Total contractual commitments ************************************* $3,322 $10,121 $2,806 $810 $17,059
The following table presents the notional amounts and fair values of derivatives by type of hedge designation at December 31, 2002 and 2001:
2002 2001
Fair Value Fair Value
Notional Notional
Amount Assets Liabilities Amount Assets Liabilities
(Dollars in millions)
BY TYPE OF HEDGE
Fair value ************************************************************ $ 420 $ — $ 64 $ — $ — $—
Cash flow *********************************************************** 3,520 69 73 607 61 1
Non qualifying ******************************************************** 13,119 239 183 13,613 228 46
Total ******************************************************** $17,059 $308 $320 $14,220 $289 $47
For the years ended December 31, 2002, 2001 and 2000, the Company recognized net investment income of $23 million, $32 million and
$13 million, respectively, from the periodic settlement of interest rate and foreign currency swaps.
During the year ended December 31, 2002, the Company recognized $30 million in net investment losses related to qualifying fair value hedges.
Accordingly, $34 million of unrealized gains on fair value hedged investments were recognized in net investment gains and losses. There were no
derivatives designated as fair value hedges during the year ended December 31, 2001. There were no discontinued hedges during the year ended
December 31, 2002.
For the years ended December 31, 2002 and 2001, the amounts accumulated in other comprehensive income relating to cash flow hedges were
losses of $24 million and gains of $71 million, respectively. During the year ended December 31, 2002, the Company recognized other comprehensive
MetLife, Inc.
F-24