MetLife 2002 Annual Report Download - page 71
Download and view the complete annual report
Please find page 71 of the 2002 MetLife annual report below. You can navigate through the pages in the report by either clicking on the pages listed below, or by using the keyword search tool below to find specific information within the annual report.-
 1
1 -
2
-
3
-
4
-
5
-
6
-
7
-
8
-
9
-
10
-
11
-
12
-
13
-
14
-
15
-
16
-
17
-
18
-
19
-
20
-
21
-
22
-
23
-
24
-
25
-
26
-
27
-
28
-
29
-
30
-
31
-
32
-
33
-
34
-
35
-
36
-
37
-
38
-
39
-
40
-
41
-
42
-
43
-
44
-
45
-
46
-
47
-
48
-
49
-
50
-
51
-
52
-
53
-
54
-
55
-
56
-
57
-
58
-
59
-
60
-
 61
61 -
 62
62 -
 63
63 -
 64
64 -
 65
65 -
 66
66 -
 67
67 -
 68
68 -
 69
69 -
 70
70 -
 71
71 -
 72
72 -
 73
73 -
 74
74 -
 75
75 -
 76
76 -
 77
77 -
 78
78 -
 79
79 -
 80
80 -
 81
81 -
82
-
83
-
84
-
85
-
86
-
87
-
88
-
89
-
90
-
91
-
92
-
93
-
94
 |
 |

METLIFE, INC.
NOTES TO CONSOLIDATED FINANCIAL STATEMENTS — (Continued)
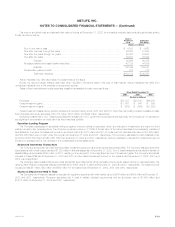
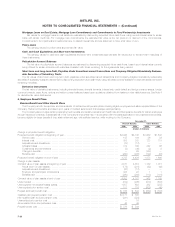
The aggregate projected benefit obligation and aggregate contract value of plan assets for the pension plans were as follows:
Non-Qualified
Qualified Plan Plan Total
2002 2001 2002 2001 2002 2001
(Dollars in millions)
Aggregate projected benefit obligation ********************************************* $(4,311) $(4,006) $(474) $(420) $(4,785) $(4,426)
Aggregate contract value of plan assets (principally Company contracts)***************** 4,053 4,161 — — 4,053 4,161
(Under) over funded ************************************************************ $ (258) $ 155 $(474) $(420) $ (732) $ (265)
The assumptions used in determining the aggregate projected benefit obligation and aggregate contract value for the pension and other benefits
were as follows:
Pension Benefits Other Benefits
2002 2001 2002 2001
Weighted average assumptions at December 31:
Discount rate*************************************************************** 4% – 9.5% 4% – 7.4% 6.5% – 7.25% 6% – 7.4%
Expected rate of return on plan assets ***************************************** 4% – 10% 4% – 9% 5.2% – 9% 6% – 9%
Rate of compensation increase *********************************************** 2% – 8% 2% – 8.5% N/A N/A
For the largest of the plans sponsored by the Company (the Metropolitan Life Retirement Plan for United States Employees, with a projected benefit
obligation of $4.3 billion or 98.6% of all qualified plans at December 31, 2002), the discount rate, expected rate of return on plan assets, and the range of
rates of future compensation increases used in that plan’s valuation at December 31, 2002 were 6.75%, 9% and 4% to 8%, respectively. The discount
rate is based on the yield of a hypothetical portfolio of high-quality debt instruments available on the valuation date, which would provide the necessary
future cash flows to pay the aggregate projected benefit obligation when due. The expected rate of return on plan assets is based on anticipated
performance of the various asset sectors, which the plan invests in, inflation expectations and long-term historical returns of the plan assets as well as
other factors. The expected rate of return on plan assets for use in that plan’s valuation in 2003 is currently anticipated to be 8.5%. The discount rate of
4% and 9.5% and the expected rate of return on plan assets of 4% and 10% are attributable to the Company’s international subsidiaries in Taiwan and
Mexico, respectively. The rate of compensation increase of 2% in 2002 and 2001 is attributable to the Company’s subsidiary in Taiwan. These rates are
indicative of the economic environments in those countries.
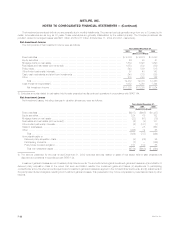
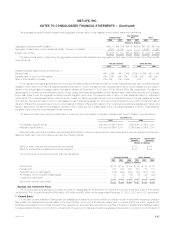
The assumed health care cost trend rates used in measuring the accumulated nonpension postretirement benefit obligation were as follows:
December 31,
2002 2001
Pre-Medicare eligible claims ****************************************** 9% down to 5% in 2010 9.5% down to 5% in 2010
Medicare eligible claims ********************************************** 11% down to 5% in 2014 11.5% down to 5% in 2014
Assumed health care cost trend rates may have a significant effect on the amounts reported for health care plans. A one-percentage point change in
assumed health care cost trend rates would have the following effects:
One Percent One Percent
Increase Decrease
(Dollars in millions)
Effect on total of service and interest cost components *********************************************** $10 $10
Effect on accumulated postretirement benefit obligation *********************************************** $90 $88
The components of net periodic benefit cost were as follows:
Pension Benefits Other Benefits
2002 2001 2000 2002 2001 2000
(Dollars in millions)
Service cost ****************************************************************** $ 105 $ 104 $ 98 $ 36 $ 34 $ 29
Interest cost******************************************************************* 308 308 291 123 115 113
Expected return on plan assets ************************************************** (356) (402) (420) (93) (108) (97)
Amortization of prior actuarial losses (gains)***************************************** 33 (2) (19) (9) (27) (22)
Curtailment cost (credit) ********************************************************* 11 21 (3) 4 6 2
Net periodic benefit cost (credit) ************************************************** $ 101 $ 29 $ (53) $ 61 $ 20 $ 25
Savings and Investment Plans
The Company sponsors savings and investment plans for substantially all employees under which the Company matches a portion of employee
contributions. The Company contributed $49 million, $55 million and $65 million for the years ended December 31, 2002, 2001 and 2000, respectively.
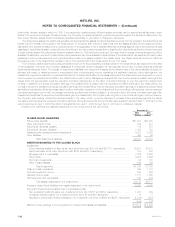
7. Closed Block
On the date of demutualization, Metropolitan Life established a closed block for the benefit of holders of certain individual life insurance policies of
Metropolitan Life. Assets have been allocated to the closed block in an amount that has been determined to produce cash flows which, together with
anticipated revenues from the policies included in the closed block, are reasonably expected to be sufficient to support obligations and liabilities relating
to these policies, including, but not limited to, provisions for the payment of claims and certain expenses and taxes, and to provide for the continuation of
MetLife, Inc. F-27