MetLife 2002 Annual Report Download - page 35
Download and view the complete annual report
Please find page 35 of the 2002 MetLife annual report below. You can navigate through the pages in the report by either clicking on the pages listed below, or by using the keyword search tool below to find specific information within the annual report.-
 1
1 -
2
-
3
-
4
-
5
-
6
-
7
-
8
-
9
-
10
-
11
-
12
-
13
-
14
-
15
-
16
-
17
-
18
-
19
-
20
-
21
-
22
-
23
-
24
-
 25
25 -
 26
26 -
 27
27 -
 28
28 -
 29
29 -
 30
30 -
 31
31 -
 32
32 -
 33
33 -
 34
34 -
 35
35 -
 36
36 -
 37
37 -
 38
38 -
 39
39 -
 40
40 -
 41
41 -
 42
42 -
 43
43 -
 44
44 -
 45
45 -
46
-
47
-
48
-
49
-
50
-
51
-
52
-
53
-
54
-
55
-
56
-
57
-
58
-
59
-
60
-
61
-
62
-
63
-
64
-
65
-
66
-
67
-
68
-
69
-
70
-
71
-
72
-
73
-
74
-
75
-
76
-
77
-
78
-
79
-
80
-
81
-
82
-
83
-
84
-
85
-
86
-
87
-
88
-
89
-
90
-
91
-
92
-
93
-
94
 |
 |

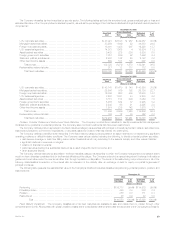
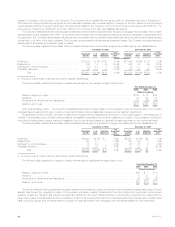
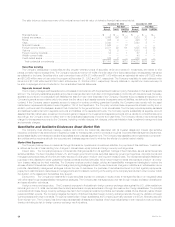
mature as follows: 4% due in one year or less; 16% due in greater than one year to five years; 23% due in greater than five years to ten years; and 57%
due in greater than ten years (calculated as a percentage of amortized cost). Additionally, such securities are concentrated by security type in
U.S. corporates (66%) and asset-backed (21%); and are concentrated by industry in utilities (34%), transportation (20%) and asset-backed (20%)
(calculated as a percentage of gross unrealized loss). Non-investment grade securities represent 53% of the $1,091 million fair value and 59% of the
$531 million gross unrealized loss.
The category of fixed maturity securities where the estimated fair value has declined and remained below amortized cost by 20% or more for six
months or greater is comprised of 57 securities with an amortized cost of $632 million and a gross unrealized loss of $234 million. These fixed maturities
mature as follows: 13% due in greater than one year to five years; 27% due in greater than five years to ten years; and 60% due in greater than ten years
(calculated as a percentage of amortized cost). Additionally, such securities are concentrated by security type in U.S. corporates (58%), foreign
governments (17%) and asset-backed (16%); and are concentrated by industry in communications (26%), foreign government (17%), asset-backed
(16%), utilities (15%) and transportation (13%) (calculated as a percentage of gross unrealized loss). Non-investment grade securities represent 74% of
the $398 million fair value and 78% of the $234 million gross unrealized loss.
The Company held 19 fixed maturity securities each with a gross unrealized loss at December 31, 2002 greater than $10 million. Seven of these
securities represent 54% of the gross unrealized loss on fixed maturities where the estimated fair value had declined and remained below amortized cost
by 20% or more for six months or greater. The estimated fair value and gross unrealized loss at December 31, 2002 for these securities were
$202 million and $125 million, respectively. These securities were concentrated in the U.S. corporate sector. The Company analyzed, on a case-by-
case basis, each of the seven fixed maturity securities as of December 31, 2002 to determine if the securities were other-than-temporarily impaired. The
Company believes that the estimated fair value of these securities, which were concentrated in the utility and transportation industries, were artificially
depressed as a result of unusually strong negative market reaction in this sector and generally poor economic and market conditions. The Company
believes that the analysis of each such security indicated that the financial strength, liquidity, leverage, future outlook and/or recent management actions
support the view that the security was not other-than-temporarily impaired as of December 31, 2002.
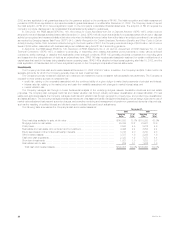
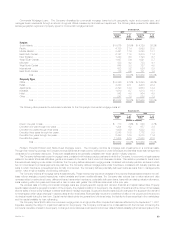
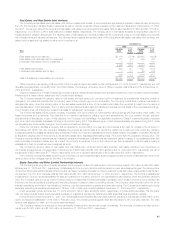
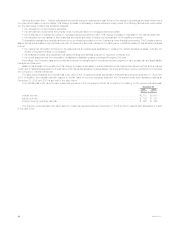
Corporate Fixed Maturities. The table below shows the major industry types that comprise the corporate bond holdings at:
December 31,
2002 2001
Estimated % of Estimated % of
Fair Value Total Fair Value Total
(Dollars in millions)
Industrial *************************************************************************** $29,077 42.5% $26,295 43.2%
Utility ****************************************************************************** 7,219 10.5 7,296 12.0
Finance**************************************************************************** 12,596 18.4 10,027 16.5
Yankee/Foreign(1) ******************************************************************* 19,229 28.1 16,985 27.9
Other ***************************************************************************** 365 0.5 245 0.4
Total ************************************************************************** $68,486 100.0% $60,848 100.0%
(1) Includes publicly traded, U.S. dollar-denominated debt obligations of foreign obligors, known as Yankee bonds, and other foreign investments.
The Company diversifies its corporate bond holdings by industry and issuer. The portfolio has no exposure to any single issuer in excess of 1% of its
total invested assets. At December 31, 2002, the Company’s combined holdings in the ten issuers to which it had the greatest exposure totaled
$2,973 million, which was less than 2% of the Company’s total invested assets at such date. The exposure to the largest single issuer of corporate
bonds the Company held at December 31, 2002 was $385 million.
At December 31, 2002 and 2001, investments of $14,778 million and $13,734 million, respectively, or 76.9% and 80.9%, respectively, of the
Yankee/Foreign sector, represented exposure to traditional Yankee bonds. The balance of this exposure was primarily U.S. dollar-denominated and
concentrated by security type in industrial and financial institutions. The Company diversifies the Yankee/Foreign portfolio by country and issuer.
The Company does not have material exposure to foreign currency risk in its invested assets. In the Company’s international insurance operations,
both its assets and liabilities are generally denominated in local currencies. Foreign currency denominated securities supporting U.S. dollar liabilities are
generally swapped back into U.S. dollars.
The Company’s exposure to future deterioration in the economic and political environment in Brazil and Argentina, with respect to its Brazilian and
Argentine related investments (including local insurance operations), is limited to the net carrying value of those assets, which totaled approximately
$357 million and $150 million, respectively, as of December 31, 2002. The net carrying value of the Company’s Brazilian and Argentine related
investments is net of writedowns for other-than-temporary impairments.
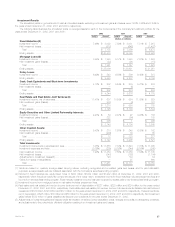
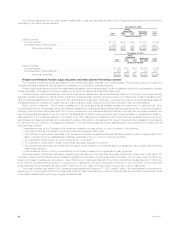
Mortgage-Backed Securities. The following table shows the types of mortgage-backed securities the Company held at:
December 31,
2002 2001
Estimated % of Estimated % of
Fair Value Total Fair Value Total
(Dollars in millions)
Pass-through securities ************************************************************** $12,515 35.9% $ 9,676 37.0%
Collateralized mortgage obligations ***************************************************** 15,511 44.5 11,140 42.5
Commercial mortgage-backed securities ************************************************ 6,857 19.6 5,364 20.5
Total ************************************************************************** $34,883 100.0% $26,180 100.0%
At December 31, 2002 and 2001, pass-through and collateralized mortgage obligations totaled $28,026 million and $20,816 million, respectively,
or 80.4% and 79.5%, respectively, of total mortgage-backed securities, and a majority of this amount represented agency-issued pass-through and
collateralized mortgage obligations guaranteed or otherwise supported by the Federal National Mortgage Association, the Federal Home Loan Mortgage
Corporation or the Government National Mortgage Association. At December 31, 2002 and 2001, approximately $3,598 million and $2,866 million,
respectively, or 52.5% and 53.4%, respectively, of the commercial mortgage-backed securities, and $27,590 million and $20,249 million, respectively,
or 98.4% and 97.3%, respectively, of the pass-through securities and collateralized mortgage obligations, were rated Aaa/AAA by Moody’s or S&P.
MetLife, Inc. 31