MetLife 2002 Annual Report Download - page 15
Download and view the complete annual report
Please find page 15 of the 2002 MetLife annual report below. You can navigate through the pages in the report by either clicking on the pages listed below, or by using the keyword search tool below to find specific information within the annual report.-
 1
1 -
2
-
3
-
4
-
 5
5 -
 6
6 -
 7
7 -
 8
8 -
 9
9 -
 10
10 -
 11
11 -
 12
12 -
 13
13 -
 14
14 -
 15
15 -
 16
16 -
 17
17 -
 18
18 -
 19
19 -
 20
20 -
 21
21 -
 22
22 -
 23
23 -
 24
24 -
 25
25 -
26
-
27
-
28
-
29
-
30
-
31
-
32
-
33
-
34
-
35
-
36
-
37
-
38
-
39
-
40
-
41
-
42
-
43
-
44
-
45
-
46
-
47
-
48
-
49
-
50
-
51
-
52
-
53
-
54
-
55
-
56
-
57
-
58
-
59
-
60
-
61
-
62
-
63
-
64
-
65
-
66
-
67
-
68
-
69
-
70
-
71
-
72
-
73
-
74
-
75
-
76
-
77
-
78
-
79
-
80
-
81
-
82
-
83
-
84
-
85
-
86
-
87
-
88
-
89
-
90
-
91
-
92
-
93
-
94
 |
 |
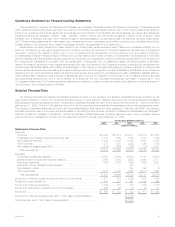
policyholder dividend obligation of $159 million and $85 million in 2001 and 2000, respectively; and additions to participating contracts of ($126) million
in 2000. Excluding the net gain on the sale of a subsidiary, net investment losses decreased from the prior year. The Company recognized deteriorating
credits through the proactive sale of certain assets.
The Company believes its policy of netting related policyholder amounts against investment gains and losses provides important information in
evaluating its operating performance. Investment gains and losses are often excluded by investors when evaluating the overall financial performance of
insurers. The Company believes its presentation enables readers of its consolidated statements of income to easily exclude investment gains and losses
and the related effects on the consolidated statements of income when evaluating its operating performance. The Company’s presentation of investment
gains and losses, net of related policyholder amounts, may be different from the presentation used by other insurance companies and, therefore,
amounts in its consolidated statements of income may not be comparable to amounts reported by other insurers.
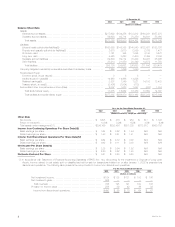
Policyholder benefits and claims rose by $1,561 million, or 9%, to $18,454 million for the year ended December 31, 2001 from $16,893 million for
the comparable 2000 period. The variance in policyholder benefits and claims is mainly attributable to increases in the Institutional, Reinsurance,
Individual, International and Auto & Home segments. Claims related to the September 11, 2001 tragedies and fourth quarter business realignment
initiatives account for $291 million and $215 million, respectively, of a $746 million increase in the Institutional segment. The remainder of the fluctuation is
attributable to growth in the group life, dental, disability and long-term care insurance businesses, commensurate with the variance in premiums, partially
offset by a decrease in policyholder benefits and claims related to the retirement and savings business. Policyholder benefits and claims for the
Reinsurance segment rose by $388 million due to unfavorable mortality experience in the first and fourth quarters of 2001, as well as adverse results on
the reinsurance of Argentine pension business, reflecting the impact of economic and political events in that country. In addition, reinsurance claims
arising from the September 11, 2001 tragedies of approximately $16 million, net of amounts recoverable from reinsurers, contributed to the variance. A
$179 million rise in the Individual segment is primarily the result of an increase in the liabilities for future policy benefits commensurate with the aging of the
in-force block of business. In addition, an increase of $74 million in the policyholder dividend obligation and $24 million in liabilities and claims associated
with the September 11, 2001 tragedies contributed to the variance. International policyholder benefits and claims increased by $127 million as a result of
growth in Mexico, South Korea and Taiwan, as well as acquisitions in Brazil and Chile. These fluctuations are partially offset by a decline in Argentina,
reflecting the impact of economic and political events in that country. A $116 million increase in the Auto & Home segment is predominantly the result of
increased average claim costs, growth in the auto business and increased non-catastrophe weather-related losses.
Interest credited to policyholder account balances grew by $149 million, or 5%, to $3,084 million for the year ended December 31, 2001 from
$2,935 million for the comparable 2000 period, primarily due to an increase of $218 million in the Individual segment, partially offset by a $77 million
reduction in the Institutional segment. The establishment of a policyholder liability of $118 million with respect to certain group annuity contracts at New
England Financial is the primary driver of the fluctuation in Individual. In addition, higher average policyholder account balances and slightly increased
crediting rates contributed to the variance. The decrease in the Institutional segment is primarily due to an overall decline in crediting rates in 2001 as a
result of the low interest rate environment, partially offset by an increase in average customer account balances stemming from asset growth. The
remaining variance is due to minor fluctuations in the Reinsurance and International segments.
Policyholder dividends increased by $167 million, or 9%, to $2,086 million for the year ended December 31, 2001 from $1,919 million for the
comparable 2000 period, primarily due to increases of $135 million and $25 million in the Institutional and Individual segments, respectively. The rise in
the Institutional segment is primarily attributed to favorable experience on a large group life contract in 2001. Policyholder dividends vary from period to
period based on participating contract experience, which is recorded in policyholder benefits and claims. The change in the Individual segment reflects
growth in the assets supporting policies associated with this segment’s aging block of traditional life insurance business. The remaining variance is due to
minor fluctuations in the International and Reinsurance segments.
Payments of $327 million were made during the second quarter of 2000, as part of Metropolitan Life’s demutualization, to holders of certain policies
transferred to Clarica Life Insurance Company in connection with the sale of a substantial portion of the Canadian operations in 1998.
Demutualization costs of $230 million were incurred during the year ended December 31, 2000. These costs are related to Metropolitan Life’s
demutualization on April 7, 2000.
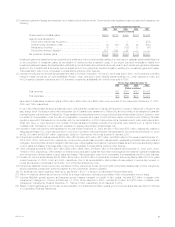
Other expenses decreased by $379 million, or 5%, to $7,022 million for the year ended December 31, 2001 from $7,401 million for the comparable
2000 period. Excluding the capitalization and amortization of deferred policy acquisition costs, which are discussed below, other expenses declined by
$138 million, or 2%, to $7,648 million in 2001 from $7,786 million in 2000. This variance is attributable to reductions in the Asset Management, Individual
and Auto & Home segments, partially offset by increases in the other segments. A decrease of $532 million in the Asset Management segment is
predominantly the result of the sales of Nvest and Conning in October 2000 and July 2001, respectively. The Individual segment’s expenses declined by
$121 million due to continued expense management, primarily due to reduced employee costs and lower discretionary spending. In addition, there were
reductions in volume-related commission expenses in the broker/dealer and other subsidiaries. These items are partially offset by an increase of
$97 million related to fourth quarter 2001 business realignment initiatives. A $34 million decrease in Auto & Home is attributable to a reduction in
integration costs associated with the acquisition of the standard personal lines property and casualty insurance operations of The St. Paul Companies in
September 1999 (‘‘St. Paul acquisition’’). An increase of $287 million in Institutional expenses is primarily driven by expenses associated with fourth
quarter business realignment initiatives of $184 million and a rise in non-deferrable variable expenses associated with premium growth in the group
insurance businesses. Non-deferrable variable expenses include premium tax, commissions and administrative expenses for dental, disability and long-
term care businesses. Other expenses in Corporate & Other grew by $198 million primarily due to a $250 million race-conscious underwriting loss
provision which was recorded in the fourth quarter of 2001, additional expenses associated with MetLife, Inc. shareholder services costs and start-up
costs relating to MetLife’s banking initiatives, as well as a decrease in the elimination of intersegment activity. These increases are partially offset by a
decline in interest expense due to reduced average levels in borrowing and a lower interest rate environment in 2001. An increase of $43 million in the
International segment is predominantly the result of growth in Mexico and South Korea, and acquisitions in Brazil and Chile, partially offset by a decrease
in Spain’s other expenses due to a planned cessation of product lines offered through a joint venture with Banco Santander. The acquisition of the
remaining interest in RGA Financial Group, LLC during the second half of 2000 contributed to the $20 million increase in other expenses in the
Reinsurance segment.
Deferred policy acquisition costs are principally amortized in proportion to gross margins or profits, including investment gains or losses. The
amortization is allocated to investment gains and losses to provide consolidated statement of income information regarding the impact of investment
gains and losses on the amount of the amortization, and other expenses to provide amounts related to gross margins or profits originating from
transactions other than investment gains and losses.
MetLife, Inc. 11