MetLife 2002 Annual Report Download - page 50
Download and view the complete annual report
Please find page 50 of the 2002 MetLife annual report below. You can navigate through the pages in the report by either clicking on the pages listed below, or by using the keyword search tool below to find specific information within the annual report.-
 1
1 -
2
-
3
-
4
-
5
-
6
-
7
-
8
-
9
-
10
-
11
-
12
-
13
-
14
-
15
-
16
-
17
-
18
-
19
-
20
-
21
-
22
-
23
-
24
-
25
-
26
-
27
-
28
-
29
-
30
-
31
-
32
-
33
-
34
-
35
-
36
-
37
-
38
-
39
-
 40
40 -
 41
41 -
 42
42 -
 43
43 -
 44
44 -
 45
45 -
 46
46 -
 47
47 -
 48
48 -
 49
49 -
 50
50 -
 51
51 -
 52
52 -
 53
53 -
 54
54 -
 55
55 -
 56
56 -
 57
57 -
 58
58 -
 59
59 -
 60
60 -
61
-
62
-
63
-
64
-
65
-
66
-
67
-
68
-
69
-
70
-
71
-
72
-
73
-
74
-
75
-
76
-
77
-
78
-
79
-
80
-
81
-
82
-
83
-
84
-
85
-
86
-
87
-
88
-
89
-
90
-
91
-
92
-
93
-
94
 |
 |

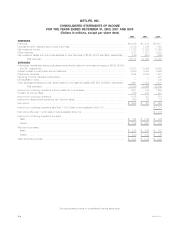
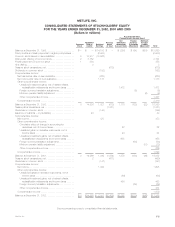
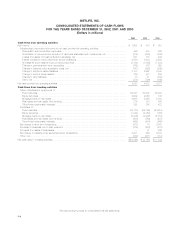
METLIFE, INC.
CONSOLIDATED STATEMENTS OF CASH FLOWS
FOR THE YEARS ENDED DECEMBER 31, 2002, 2001 AND 2000
(Dollars in millions)
2002 2001 2000
Cash flows from operating activities
Net income************************************************************************************* $ 1,605 $ 473 $ 953
Adjustments to reconcile net income to net cash provided by operating activities:
Depreciation and amortization expenses********************************************************* 449 480 369
Amortization of premiums and accretion of discounts associated with investments, net****************** (519) (575) (452)
Losses from sales of investments and businesses, net ******************************************** 931 737 444
Interest credited to other policyholder account balances ******************************************* 2,950 3,084 2,935
Universal life and investment-type product policy fees ********************************************* (2,139) (1,889) (1,820)
Change in premiums and other receivables ****************************************************** (795) 476 925
Change in deferred policy acquisition costs, net ************************************************** (741) (563) (560)
Change in insurance-related liabilities *********************************************************** 3,137 2,567 2,042
Change in income taxes payable*************************************************************** 479 477 239
Change in other liabilities ********************************************************************* 18 41 (933)
Other, net ********************************************************************************** (378) (796) (865)
Net cash provided by operating activities ************************************************************ 4,997 4,512 3,277
Cash flows from investing activities
Sales, maturities and repayments of:
Fixed maturities ***************************************************************************** 64,327 52,382 56,940
Equity securities ***************************************************************************** 2,642 2,065 748
Mortgage loans on real estate ***************************************************************** 2,603 2,069 2,163
Real estate and real estate joint ventures ******************************************************** 276 303 606
Other limited partnership interests ************************************************************** 355 396 422
Purchases of:
Fixed maturities ***************************************************************************** (85,173) (52,160) (64,918)
Equity securities ***************************************************************************** (1,242) (3,059) (863)
Mortgage loans on real estate ***************************************************************** (3,206) (3,596) (2,787)
Real estate and real estate joint ventures ******************************************************** (208) (769) (407)
Other limited partnership interests ************************************************************** (456) (424) (660)
Net change in short-term investments************************************************************* (477) 74 2,043
Purchase of business, net of cash received******************************************************** (879) (276) (416)
Proceeds from sales of businesses*************************************************************** — 81 869
Net change in payable under securities loaned transactions ****************************************** 5,201 360 5,840
Other, net ************************************************************************************ (759) (611) (812)
Net cash used in investing activities **************************************************************** $(16,996) $ (3,165) $ (1,232)
See accompanying notes to consolidated financial statements.
F-6