MetLife 2002 Annual Report Download - page 18
Download and view the complete annual report
Please find page 18 of the 2002 MetLife annual report below. You can navigate through the pages in the report by either clicking on the pages listed below, or by using the keyword search tool below to find specific information within the annual report.-
 1
1 -
2
-
3
-
4
-
5
-
6
-
7
-
 8
8 -
 9
9 -
 10
10 -
 11
11 -
 12
12 -
 13
13 -
 14
14 -
 15
15 -
 16
16 -
 17
17 -
 18
18 -
 19
19 -
 20
20 -
 21
21 -
 22
22 -
 23
23 -
 24
24 -
 25
25 -
 26
26 -
 27
27 -
 28
28 -
29
-
30
-
31
-
32
-
33
-
34
-
35
-
36
-
37
-
38
-
39
-
40
-
41
-
42
-
43
-
44
-
45
-
46
-
47
-
48
-
49
-
50
-
51
-
52
-
53
-
54
-
55
-
56
-
57
-
58
-
59
-
60
-
61
-
62
-
63
-
64
-
65
-
66
-
67
-
68
-
69
-
70
-
71
-
72
-
73
-
74
-
75
-
76
-
77
-
78
-
79
-
80
-
81
-
82
-
83
-
84
-
85
-
86
-
87
-
88
-
89
-
90
-
91
-
92
-
93
-
94
 |
 |

slightly higher crediting rates and higher policyholder account balances stemming from increased sales, including products with a dollar cost averaging-
type feature.
Policyholder dividends increased by $25 million, or 1%, to $1,767 million for the year ended December 31, 2001 from $1,742 million for the
comparable 2000 period. This is largely attributable to the growth in the assets supporting policies associated with this segment’s aging block of
traditional life insurance business.
Other expenses decreased by $265 million, or 9%, to $2,747 for the year ended December 31, 2001 from $3,012 million for the comparable 2000
period. Excluding the capitalization and amortization of deferred policy acquisition costs that are discussed below, other expenses are lower by
$121 million, or 4%, to $3,040 million in 2001 from $3,161 million in 2000. Other expenses related to insurance products decreased by $158 million due
to continued expense management, primarily due to reduced employee costs and lower discretionary spending. In addition, there were reductions in
volume-related commission expenses in the broker/dealer and other subsidiaries. These decreases are partially offset by an increase of $62 million
related to fourth quarter 2001 business realignment initiatives. The annuity and investment-type products experienced an increase in other expenses of
$37 million primarily due to expenses associated with the business realignment initiatives.
Deferred policy acquisition costs are principally amortized in proportion to gross margins and profits, including investment gains or losses. The
amortization is allocated to investment gains and losses to provide consolidated statement of income information regarding the impact of investment
gains and losses on the amount of the amortization, and to other expenses to provide amounts related to gross margins and profits originating from
transactions other than investment gains and losses.
Capitalization of deferred policy acquisition costs increased by $54 million, or 6%, to $926 million for the year ended December 31, 2001 from
$872 million for the comparable 2000 period. This increase is primarily due to higher sales of variable and universal life insurance policies and annuity and
investment-type products, resulting in higher commissions and other deferrable expenses. Total amortization of deferred policy acquisition costs
increased by $26 million, or 4%, to $654 million in 2001 from $628 million in 2000. Amortization of deferred policy acquisition costs of $633 million and
$723 million is allocated to other expenses in 2001 and 2000, respectively, while the remainder of the amortization in each year is allocated to investment
gains and losses. Amortization of deferred policy acquisition costs allocated to other expenses related to insurance products declined by $48 million due
to changes in the estimate of future gross margins and profits. Amortization of deferred policy acquisition costs allocated to other expenses related to
annuity and investment products declined by $42 million due to changes in the estimate of future gross profits. Contributing to this variance are
modifications made in the third quarter of 2001 relating to the manner in which estimates of future market performance are developed. These estimates
are used in determining unamortized deferred policy acquisition costs balances and the amount of related amortization. The modification reflects an
expected impact of past market performance on future market performance, and improves the ability to estimate deferred policy acquisition costs
balances and related amortization.
Institutional
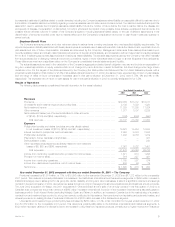
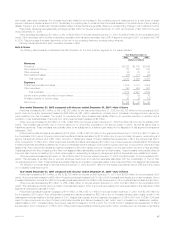
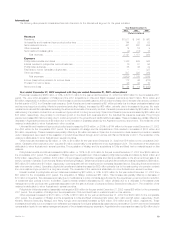
The following table presents consolidated financial information for the Institutional segment for the years indicated:
Year Ended December 31,
2002 2001 2000
(Dollars in millions)
Revenues
Premiums************************************************************************ $ 8,254 $ 7,288 $ 6,900
Universal life and investment-type product policy fees *********************************** 615 592 547
Net investment income ************************************************************ 3,928 3,966 3,712
Other revenues ******************************************************************* 609 649 650
Net investment losses ************************************************************* (506) (15) (475)
Total revenues**************************************************************** 12,900 12,480 11,334
Expenses
Policyholder benefits and claims ***************************************************** 9,339 8,924 8,178
Interest credited to policyholder account balances ************************************** 932 1,013 1,090
Policyholder dividends ************************************************************* 115 259 124
Other expenses ****************************************************************** 1,531 1,746 1,514
Total expenses *************************************************************** 11,917 11,942 10,906
Income from continuing operations before provision for income taxes ********************** 983 538 428
Provision for income taxes********************************************************** 347 179 142
Income from continuing operations*************************************************** 636 359 286
Income from discontinued operations, net of income taxes******************************* 123 23 21
Net income ********************************************************************** $ 759 $ 382 $ 307
Year ended December 31, 2002 compared with the year ended December 31, 2001—Institutional
Premiums increased by $966 million, or 13%, to $8,254 million for the year ended December 31, 2002 from $7,288 million for the comparable
2001 period. Group insurance premiums increased by $505 million as a result of growth in this segment’s group life, dental, disability and long-term care
businesses. Retirement and savings premiums increased by $461 million primarily due to the sale of a significant contract in the second quarter of 2002,
as well as new sales throughout 2002 from structured settlements and traditional annuity products. Retirement and savings premium levels are
significantly influenced by large transactions and, as a result, can fluctuate from period to period.
Universal life and investment-type product policy fees increased by $23 million, or 4%, to $615 million for the year ended December 31, 2002 from
$592 million for the comparable 2001 period. This increase is primarily attributable to a fee resulting from the renegotiation of a portion of a bank-owned
life insurance contract, as well as growth in existing business in the group universal life product line.
Other revenues decreased by $40 million, or 6%, to $609 million for the year ended December 31, 2002 from $649 million for the comparable 2001
period. Retirement and savings other revenues decreased $73 million primarily due to a reduction in administrative fees as a result of the Company’s exit
from the large market 401(k) business in late 2001, and lower fees earned on investments in separate accounts resulting generally from poor equity
MetLife, Inc.
14