MetLife 2002 Annual Report Download - page 31
Download and view the complete annual report
Please find page 31 of the 2002 MetLife annual report below. You can navigate through the pages in the report by either clicking on the pages listed below, or by using the keyword search tool below to find specific information within the annual report.-
 1
1 -
2
-
3
-
4
-
5
-
6
-
7
-
8
-
9
-
10
-
11
-
12
-
13
-
14
-
15
-
16
-
17
-
18
-
19
-
20
-
 21
21 -
 22
22 -
 23
23 -
 24
24 -
 25
25 -
 26
26 -
 27
27 -
 28
28 -
 29
29 -
 30
30 -
 31
31 -
 32
32 -
 33
33 -
 34
34 -
 35
35 -
 36
36 -
 37
37 -
 38
38 -
 39
39 -
 40
40 -
 41
41 -
42
-
43
-
44
-
45
-
46
-
47
-
48
-
49
-
50
-
51
-
52
-
53
-
54
-
55
-
56
-
57
-
58
-
59
-
60
-
61
-
62
-
63
-
64
-
65
-
66
-
67
-
68
-
69
-
70
-
71
-
72
-
73
-
74
-
75
-
76
-
77
-
78
-
79
-
80
-
81
-
82
-
83
-
84
-
85
-
86
-
87
-
88
-
89
-
90
-
91
-
92
-
93
-
94
 |
 |

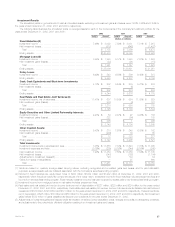
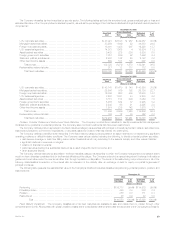
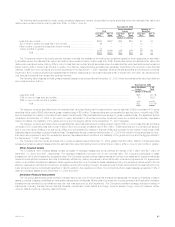
Investment Results
The annualized yields on general account cash and invested assets, excluding net investment gains and losses, were 7.20%, 7.56% and 7.54% for
the years ended December 31, 2002, 2001 and 2000, respectively.
The following table illustrates the annualized yields on average assets for each of the components of the Company’s investment portfolio for the
years ended December 31, 2002, 2001 and 2000:
2002 2001 2000
Yield(1) Amount Yield(1) Amount Yield(1) Amount
(Dollars in millions)
Fixed Maturities:(2)
Investment income ********************************************* 7.46% $ 8,092 7.89% $ 8,031 7.81% $ 7,915
Net investment losses******************************************* (917) (645) (1,437)
Total ******************************************************* $ 7,175 $ 7,386 $ 6,478
Ending assets ************************************************* $140,533 $115,398 $112,979
Mortgage Loans:(3)
Investment income ********************************************* 7.84% $ 1,883 8.17% $ 1,848 7.87% $ 1,693
Net investment gains (losses)************************************* (22) (91) (18)
Total ******************************************************* $ 1,861 $ 1,757 $ 1,675
Ending assets ************************************************* $ 25,086 $ 23,621 $ 21,951
Policy Loans:
Investment income ********************************************* 6.49% $ 543 6.56% $ 536 6.45% $ 515
Ending assets ************************************************* $ 8,580 $ 8,272 $ 8,158
Cash, Cash Equivalents and Short-term Investments:
Investment income ********************************************* 4.17% $ 232 5.54% $ 279 5.72% $ 288
Net investment losses******************************************* —(5)—
Total ******************************************************* $ 232 $ 274 $ 288
Ending assets ************************************************* $ 4,244 $ 8,676 $ 4,703
Real Estate and Real Estate Joint Ventures:(4)
Investment income, net of expenses******************************* 11.41% $ 637 10.58% $ 584 11.09% $ 629
Net investment gains (losses)************************************* 576 (4) 101
Total ******************************************************* $ 1,213 $ 580 $ 730
Ending assets ************************************************* $ 4,725 $ 5,730 $ 5,504
Equity Securities and Other Limited Partnership Interests:
Investment income ********************************************* 2.21% $ 83 2.37% $ 97 4.98% $ 183
Net investment gains (losses)************************************* 222 (96) 185
Total ******************************************************* $ 305 $ 1 $ 368
Ending assets ************************************************* $ 3,743 $ 4,700 $ 3,845
Other Invested Assets:
Investment income ********************************************* 6.42% $ 218 7.60% $ 249 6.30% $ 162
Net investment gains (losses)************************************* (206) 79 65
Total ******************************************************* $ 12 $ 328 $ 227
Ending assets ************************************************* $ 3,727 $ 3,298 $ 2,821
Total Investments:
Investment income before expenses and fees*********************** 7.35% $ 11,688 7.72% $ 11,624 7.70% $ 11,385
Investment expenses and fees *********************************** (0.15%) (235) (0.16%) (244) (0.16%) (240)
Net investment income ****************************************** 7.20% $ 11,453 7.56% $ 11,380 7.54% $ 11,145
Net investment losses******************************************* (347) (762) (1,104)
Adjustments to investment losses(5) ******************************* 145 134 54
Gains from sales of subsidiaries ********************************** — 25 660
Total ******************************************************* $ 11,251 $ 10,777 $ 10,755
(1) Yields are based on quarterly average asset carrying values, excluding recognized and unrealized gains and losses, and for yield calculation
purposes, average assets exclude collateral associated with the Company’s securities lending program.
(2) Included in fixed maturities are equity-linked notes of $834 million, $1,004 million and $1,232 million at December 31, 2002, 2001 and 2000,
respectively, which include an equity-like component as part of the notes’ return. Investment income for fixed maturities includes prepayment fees and
income from the securities lending program. Fixed maturity investment income has been reduced by rebates paid under the securities lending program.
(3) Investment income from mortgage loans on real estate includes prepayment fees.
(4) Real estate and real estate joint venture income is shown net of depreciation of $227 million, $220 million and $224 million for the years ended
December 31, 2002, 2001 and 2000, respectively. Real estate and real estate joint venture income includes amounts classified as discontinued
operations of $124 million, $125 million and $121 million for the years ended December 31, 2002, 2001 and 2000, respectively. These amounts are
net of depreciation of $48 million, $79 million and $80 million for the years ended December 31, 2002, 2001 and 2000, respectively. Net investment
gains include $582 million of gains classified as discontinued operations for the year ended December 31, 2002.
(5) Adjustments to investment gains and losses include amortization of deferred policy acquisition costs, charges and credits to participating contracts,
and adjustments to the policyholder dividend obligation resulting from investment gains and losses.
MetLife, Inc. 27