MetLife 2002 Annual Report Download - page 62
Download and view the complete annual report
Please find page 62 of the 2002 MetLife annual report below. You can navigate through the pages in the report by either clicking on the pages listed below, or by using the keyword search tool below to find specific information within the annual report.-
 1
1 -
2
-
3
-
4
-
5
-
6
-
7
-
8
-
9
-
10
-
11
-
12
-
13
-
14
-
15
-
16
-
17
-
18
-
19
-
20
-
21
-
22
-
23
-
24
-
25
-
26
-
27
-
28
-
29
-
30
-
31
-
32
-
33
-
34
-
35
-
36
-
37
-
38
-
39
-
40
-
41
-
42
-
43
-
44
-
45
-
46
-
47
-
48
-
49
-
50
-
51
-
 52
52 -
 53
53 -
 54
54 -
 55
55 -
 56
56 -
 57
57 -
 58
58 -
 59
59 -
 60
60 -
 61
61 -
 62
62 -
 63
63 -
 64
64 -
 65
65 -
 66
66 -
 67
67 -
 68
68 -
 69
69 -
 70
70 -
 71
71 -
 72
72 -
73
-
74
-
75
-
76
-
77
-
78
-
79
-
80
-
81
-
82
-
83
-
84
-
85
-
86
-
87
-
88
-
89
-
90
-
91
-
92
-
93
-
94
 |
 |

METLIFE, INC.
NOTES TO CONSOLIDATED FINANCIAL STATEMENTS — (Continued)
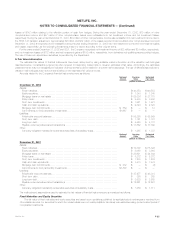
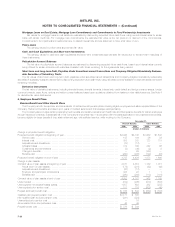
3. Investments
Fixed Maturities and Equity Securities
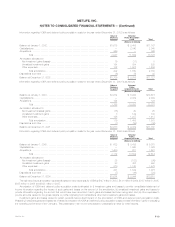
Fixed maturities and equity securities at December 31, 2002 were as follows:
Cost or Gross Unrealized
Amortized Estimated
Cost Gain Loss Fair Value
(Dollars in millions)
Fixed Maturities:
Bonds:
U.S. corporate securities************************************************** $ 47,021 $3,193 $ 957 $ 49,257
Mortgage-backed securities *********************************************** 33,256 1,649 22 34,883
Foreign corporate securities *********************************************** 18,001 1,435 207 19,229
U.S. treasuries/agencies ************************************************** 14,373 1,565 4 15,934
Asset-backed securities ************************************************** 9,483 228 208 9,503
Foreign government securities ********************************************* 7,012 636 52 7,596
States and political subdivisions ******************************************** 2,580 182 20 2,742
Other fixed income assets ************************************************ 609 191 103 697
Total bonds ********************************************************* 132,335 9,079 1,573 139,841
Redeemable preferred stocks************************************************ 817 12 117 712
Total fixed maturities************************************************** $133,152 $9,091 $1,690 $140,553
Equity Securities:
Common stocks*********************************************************** $ 877 $ 115 $ 79 $ 913
Nonredeemable preferred stocks ********************************************* 426 13 4 435
Total equity securities************************************************* $ 1,303 $ 128 $ 83 $ 1,348
Fixed maturities and equity securities at December 31, 2001 were as follows:
Cost or Gross Unrealized
Amortized Estimated
Cost Gain Loss Fair Value
(Dollars in millions)
Fixed Maturities:
Bonds:
U.S. corporate securities************************************************** $ 43,141 $1,470 $ 748 $ 43,863
Mortgage-backed securities *********************************************** 25,506 866 192 26,180
Foreign corporate securities *********************************************** 16,836 688 539 16,985
U.S. treasuries/agencies ************************************************** 8,297 1,031 43 9,285
Asset-backed securities ************************************************** 8,115 154 206 8,063
Foreign government securities ********************************************* 5,488 544 37 5,995
States and political subdivisions ******************************************** 2,248 68 21 2,295
Other fixed income assets ************************************************ 1,874 238 142 1,970
Total bonds ********************************************************* 111,505 5,059 1,928 114,636
Redeemable preferred stocks************************************************ 783 12 33 762
Total fixed maturities************************************************** $112,288 $5,071 $1,961 $115,398
Equity Securities:
Common stocks*********************************************************** $ 1,968 $ 657 $ 78 $ 2,547
Nonredeemable preferred stocks ********************************************* 491 28 3 516
Total equity securities************************************************* $ 2,459 $ 685 $ 81 $ 3,063
The Company held foreign currency derivatives with notional amounts of $2,371 million and $1,925 million to hedge the exchange rate risk
associated with foreign bonds at December 31, 2002 and 2001, respectively.
The Company held fixed maturities at estimated fair values that were below investment grade or not rated by an independent rating agency that
totaled $11,286 million and $9,790 million at December 31, 2002 and 2001, respectively. Non-income producing fixed maturities were $416 million and
$237 million at December 31, 2002 and 2001, respectively.
MetLife, Inc.
F-18