Kodak 2010 Annual Report Download - page 97
Download and view the complete annual report
Please find page 97 of the 2010 Kodak annual report below. You can navigate through the pages in the report by either clicking on the pages listed below, or by using the keyword search tool below to find specific information within the annual report.-
 1
1 -
2
-
3
-
4
-
5
-
6
-
7
-
8
-
9
-
10
-
11
-
12
-
13
-
14
-
15
-
16
-
17
-
18
-
19
-
20
-
21
-
22
-
23
-
24
-
25
-
26
-
27
-
28
-
29
-
30
-
31
-
32
-
33
-
34
-
35
-
36
-
37
-
38
-
39
-
40
-
41
-
42
-
43
-
44
-
45
-
46
-
47
-
48
-
49
-
50
-
51
-
52
-
53
-
54
-
55
-
56
-
57
-
58
-
59
-
60
-
61
-
62
-
63
-
64
-
65
-
66
-
67
-
68
-
69
-
70
-
71
-
72
-
73
-
74
-
75
-
76
-
77
-
78
-
79
-
80
-
81
-
82
-
83
-
84
-
85
-
86
-
 87
87 -
 88
88 -
 89
89 -
 90
90 -
 91
91 -
 92
92 -
 93
93 -
 94
94 -
 95
95 -
 96
96 -
 97
97 -
 98
98 -
 99
99 -
 100
100 -
 101
101 -
 102
102 -
 103
103 -
 104
104 -
 105
105 -
 106
106 -
 107
107 -
108
-
109
-
110
-
111
-
112
-
113
-
114
-
115
-
116
-
117
-
118
-
119
-
120
-
121
-
122
-
123
-
124
-
125
-
126
-
127
-
128
-
129
-
130
-
131
-
132
-
133
-
134
-
135
-
136
-
137
-
138
-
139
-
140
-
141
-
142
-
143
-
144
-
145
-
146
-
147
-
148
-
149
-
150
-
151
-
152
-
153
-
154
-
155
-
156
-
157
-
158
-
159
-
160
-
161
-
162
-
163
-
164
-
165
-
166
-
167
-
168
-
169
-
170
-
171
-
172
-
173
-
174
-
175
-
176
-
177
-
178
-
179
-
180
-
181
-
182
-
183
-
184
-
185
-
186
-
187
-
188
-
189
-
190
-
191
-
192
-
193
-
194
-
195
-
196
-
197
-
198
-
199
-
200
-
201
-
202
-
203
-
204
-
205
-
206
-
207
-
208
 |
 |

95
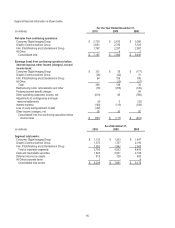
Segment financial information is shown below.
For the Year Ended December 31,
(in millions)
2010
2009
2008
Net sales from continuing operations:
Consumer Digital Imaging Group
$ 2,739
$ 2,619
$ 3,088
Graphic Communications Group
2,681
2,726
3,334
Film, Photofinishing and Entertainment Group
1,767
2,257
2,987
All Other
-
4
7
Consolidated total
$ 7,187
$ 7,606
$ 9,416
Earnings (loss) from continuing operations before
interest expense, other income (charges), net and
income taxes:
Consumer Digital Imaging Group
$ 331
$ 35
$ (177)
Graphic Communications Group
(26)
(42)
31
Film, Photofinishing and Entertainment Group
64
159
196
All Other
-
(13)
(17)
Total
369
139
33
Restructuring costs, rationalization and other
(78)
(258)
(149)
Postemployment benefit changes
-
-
94
Other operating (expenses) income, net
(619)
88
(766)
Adjustments to contingencies and legal
reserves/settlements
(8)
3
(33)
Interest expense
(149)
(119)
(108)
Loss on early extinguishment of debt
(102)
-
-
Other income (charges), net
26
30
55
Consolidated loss from continuing operations before
income taxes
$ (561)
$ (117)
$ (874)
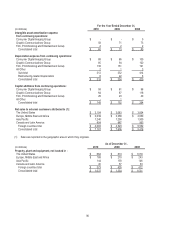
As of December 31,
(in millions)
2010
2009
2008
Segment total assets:
Consumer Digital Imaging Group
$ 1,133
$ 1,203
$ 1,647
Graphic Communications Group
1,570
1,737
2,190
Film, Photofinishing and Entertainment Group
1,092
1,992
2,563
Total of reportable segments
3,795
4,932
6,400
Cash and marketable securities
1,628
2,031
2,155
Deferred income tax assets
815
728
620
All Other/corporate items
1
-
4
Consolidated total assets
$ 6,239
$ 7,691
$ 9,179