Kodak 2010 Annual Report Download - page 92
Download and view the complete annual report
Please find page 92 of the 2010 Kodak annual report below. You can navigate through the pages in the report by either clicking on the pages listed below, or by using the keyword search tool below to find specific information within the annual report.-
 1
1 -
2
-
3
-
4
-
5
-
6
-
7
-
8
-
9
-
10
-
11
-
12
-
13
-
14
-
15
-
16
-
17
-
18
-
19
-
20
-
21
-
22
-
23
-
24
-
25
-
26
-
27
-
28
-
29
-
30
-
31
-
32
-
33
-
34
-
35
-
36
-
37
-
38
-
39
-
40
-
41
-
42
-
43
-
44
-
45
-
46
-
47
-
48
-
49
-
50
-
51
-
52
-
53
-
54
-
55
-
56
-
57
-
58
-
59
-
60
-
61
-
62
-
63
-
64
-
65
-
66
-
67
-
68
-
69
-
70
-
71
-
72
-
73
-
74
-
75
-
76
-
77
-
78
-
79
-
80
-
81
-
 82
82 -
 83
83 -
 84
84 -
 85
85 -
 86
86 -
 87
87 -
 88
88 -
 89
89 -
 90
90 -
 91
91 -
 92
92 -
 93
93 -
 94
94 -
 95
95 -
 96
96 -
 97
97 -
 98
98 -
 99
99 -
 100
100 -
 101
101 -
 102
102 -
103
-
104
-
105
-
106
-
107
-
108
-
109
-
110
-
111
-
112
-
113
-
114
-
115
-
116
-
117
-
118
-
119
-
120
-
121
-
122
-
123
-
124
-
125
-
126
-
127
-
128
-
129
-
130
-
131
-
132
-
133
-
134
-
135
-
136
-
137
-
138
-
139
-
140
-
141
-
142
-
143
-
144
-
145
-
146
-
147
-
148
-
149
-
150
-
151
-
152
-
153
-
154
-
155
-
156
-
157
-
158
-
159
-
160
-
161
-
162
-
163
-
164
-
165
-
166
-
167
-
168
-
169
-
170
-
171
-
172
-
173
-
174
-
175
-
176
-
177
-
178
-
179
-
180
-
181
-
182
-
183
-
184
-
185
-
186
-
187
-
188
-
189
-
190
-
191
-
192
-
193
-
194
-
195
-
196
-
197
-
198
-
199
-
200
-
201
-
202
-
203
-
204
-
205
-
206
-
207
-
208
 |
 |

90
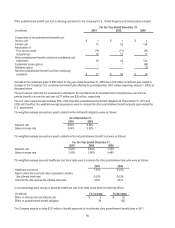
Other postretirement benefit cost from continuing operations for the Company's U.S., United Kingdom and Canada plans included:
For the Year Ended December 31,
(in millions)
2010
2009
2008
Components of net postretirement benefit cost:
Service cost
$ 1
$ 1
$ 4
Interest cost
72
92
136
Amortization of:
Prior service credit
(76)
(71)
(53)
Actuarial loss
28
22
17
Other postretirement benefit cost before curtailments and
settlements
25
44
104
Curtailment losses (gains)
-
1
(86)
Settlement gains
-
-
(2)
Net other postretirement benefit cost from continuing
operations
$ 25
$ 45
$ 16
Included in the curtailment gains of $86 million for the year ended December 31, 2008 was a $79 million curtailment gain related to
changes to the Company’s U.S. postretirement benefit plan affecting its post-September 1991 retirees beginning January 1, 2009, as
discussed above.
The prior service credit and net actuarial loss estimated to be amortized from Accumulated other comprehensive loss into net
periodic benefit cost over the next year is $77 million and $33 million, respectively.
The U.S. plan represents approximately 93% of the total other postretirement net benefit obligation as of December 31, 2010 and
2009 and, therefore, the weighted-average assumptions used to compute the other postretirement benefit amounts approximate the
U.S. assumptions.
The weighted-average assumptions used to determine the net benefit obligations were as follows:
As of December 31,
2010
2009
Discount rate
5.03%
5.54%
Salary increase rate
3.84%
3.90%
The weighted-average assumptions used to determine the net postretirement benefit cost were as follows:
For the Year Ended December 31,
2010
2009
2008
Discount rate
5.93%
6.59%
7.23%
Salary increase rate
3.90%
3.96%
4.48%
The weighted-average assumed healthcare cost trend rates used to compute the other postretirement amounts were as follows:
2010
2009
Healthcare cost trend
7.50%
8.00%
Rate to which the cost trend rate is assumed to decline
(the ultimate trend rate)
5.00%
5.00%
Year that the rate reaches the ultimate trend rate
2016
2013
A one-percentage point change in assumed healthcare cost trend rates would have the following effects:
(in millions)
1% increase
1% decrease
Effect on total service and interest cost
$ 2
$ (1)
Effect on postretirement benefit obligation
29
(25)
The Company expects to make $133 million of benefit payments for its unfunded other postretirement benefit plans in 2011.