Kodak 2010 Annual Report Download - page 180
Download and view the complete annual report
Please find page 180 of the 2010 Kodak annual report below. You can navigate through the pages in the report by either clicking on the pages listed below, or by using the keyword search tool below to find specific information within the annual report.-
 1
1 -
2
-
3
-
4
-
5
-
6
-
7
-
8
-
9
-
10
-
11
-
12
-
13
-
14
-
15
-
16
-
17
-
18
-
19
-
20
-
21
-
22
-
23
-
24
-
25
-
26
-
27
-
28
-
29
-
30
-
31
-
32
-
33
-
34
-
35
-
36
-
37
-
38
-
39
-
40
-
41
-
42
-
43
-
44
-
45
-
46
-
47
-
48
-
49
-
50
-
51
-
52
-
53
-
54
-
55
-
56
-
57
-
58
-
59
-
60
-
61
-
62
-
63
-
64
-
65
-
66
-
67
-
68
-
69
-
70
-
71
-
72
-
73
-
74
-
75
-
76
-
77
-
78
-
79
-
80
-
81
-
82
-
83
-
84
-
85
-
86
-
87
-
88
-
89
-
90
-
91
-
92
-
93
-
94
-
95
-
96
-
97
-
98
-
99
-
100
-
101
-
102
-
103
-
104
-
105
-
106
-
107
-
108
-
109
-
110
-
111
-
112
-
113
-
114
-
115
-
116
-
117
-
118
-
119
-
120
-
121
-
122
-
123
-
124
-
125
-
126
-
127
-
128
-
129
-
130
-
131
-
132
-
133
-
134
-
135
-
136
-
137
-
138
-
139
-
140
-
141
-
142
-
143
-
144
-
145
-
146
-
147
-
148
-
149
-
150
-
151
-
152
-
153
-
154
-
155
-
156
-
157
-
158
-
159
-
160
-
161
-
162
-
163
-
164
-
165
-
166
-
167
-
168
-
169
-
 170
170 -
 171
171 -
 172
172 -
 173
173 -
 174
174 -
 175
175 -
 176
176 -
 177
177 -
 178
178 -
 179
179 -
 180
180 -
 181
181 -
 182
182 -
 183
183 -
 184
184 -
 185
185 -
 186
186 -
 187
187 -
 188
188 -
 189
189 -
 190
190 -
191
-
192
-
193
-
194
-
195
-
196
-
197
-
198
-
199
-
200
-
201
-
202
-
203
-
204
-
205
-
206
-
207
-
208
 |
 |

54
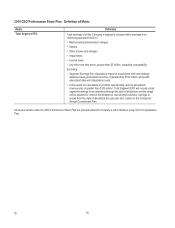
EXCEL: Definitions of Metrics
In 2010, the Committee selected Cash Generation and Year-over-Year Digital Revenue Growth as the primary performance metrics for
EXCEL. The definitions are as follows:
Metric
Definition
Cash Generation
Net cash flow provided by (used in) operating activities from continuing operations,
as determined under U.S. GAAP, excluding:
• Restructuring/rationalization payments
• Net cash flow from the operating results of acquisitions or new strategic alliances
having an annualized revenue of greater than $100 million
• Share issuance, share repurchases, including associated costs, expenses and
fees
• Debt actions, including costs, expenses, fees, and discounts associated with
amendments, revisions, issuances, re-issuances, or other actions related to the
Company’s debt portfolio, including revolving credit agreements
• Cash consideration paid for acquisitions or new strategic alliances along with the
associated deal and integration costs
• Investments in unconsolidated entities
• Movements or transfers of cash to marketable securities or other interest-
bearing investments or accounts
• Dividend payments
Including:
• Net cash flow generated by divested businesses, through the date of divestiture,
including business divestitures categorized as continuing operations or
discontinued operations
• Proceeds from asset sales, agreements, settlements, and divestitures
• Capital expenditures
Year-over-Year Digital Revenue Growth
Year-over-year growth is defined as the percent change in total combined segment
net revenue, as reported, for the full year 2010 of Consumer Digital Imaging Group
and Graphic Communications Group versus full year 2009. In the event of a
divestiture or portfolio repositioning of greater than $100 million, the metric would be
revised and restated to remove the divested or repositioned business revenue as
reflected in the Company’s Annual Commitment Plan, from the time of divestiture
until year end.