Kodak 2010 Annual Report Download - page 175
Download and view the complete annual report
Please find page 175 of the 2010 Kodak annual report below. You can navigate through the pages in the report by either clicking on the pages listed below, or by using the keyword search tool below to find specific information within the annual report.-
 1
1 -
2
-
3
-
4
-
5
-
6
-
7
-
8
-
9
-
10
-
11
-
12
-
13
-
14
-
15
-
16
-
17
-
18
-
19
-
20
-
21
-
22
-
23
-
24
-
25
-
26
-
27
-
28
-
29
-
30
-
31
-
32
-
33
-
34
-
35
-
36
-
37
-
38
-
39
-
40
-
41
-
42
-
43
-
44
-
45
-
46
-
47
-
48
-
49
-
50
-
51
-
52
-
53
-
54
-
55
-
56
-
57
-
58
-
59
-
60
-
61
-
62
-
63
-
64
-
65
-
66
-
67
-
68
-
69
-
70
-
71
-
72
-
73
-
74
-
75
-
76
-
77
-
78
-
79
-
80
-
81
-
82
-
83
-
84
-
85
-
86
-
87
-
88
-
89
-
90
-
91
-
92
-
93
-
94
-
95
-
96
-
97
-
98
-
99
-
100
-
101
-
102
-
103
-
104
-
105
-
106
-
107
-
108
-
109
-
110
-
111
-
112
-
113
-
114
-
115
-
116
-
117
-
118
-
119
-
120
-
121
-
122
-
123
-
124
-
125
-
126
-
127
-
128
-
129
-
130
-
131
-
132
-
133
-
134
-
135
-
136
-
137
-
138
-
139
-
140
-
141
-
142
-
143
-
144
-
145
-
146
-
147
-
148
-
149
-
150
-
151
-
152
-
153
-
154
-
155
-
156
-
157
-
158
-
159
-
160
-
161
-
162
-
163
-
164
-
 165
165 -
 166
166 -
 167
167 -
 168
168 -
 169
169 -
 170
170 -
 171
171 -
 172
172 -
 173
173 -
 174
174 -
 175
175 -
 176
176 -
 177
177 -
 178
178 -
 179
179 -
 180
180 -
 181
181 -
 182
182 -
 183
183 -
 184
184 -
 185
185 -
186
-
187
-
188
-
189
-
190
-
191
-
192
-
193
-
194
-
195
-
196
-
197
-
198
-
199
-
200
-
201
-
202
-
203
-
204
-
205
-
206
-
207
-
208
 |
 |

49
COMPENSATION OF NAMED EXECUTIVE OFFICERS
SUMMARY COMPENSATION TABLE
The table below summarizes the total compensation of each of our Named Executive Officers for 2008, 2009, and 2010:
Name and
Principal
Position
Year
Salary(1)
Bonus
Stock
Awards(2)
Option
Awards(3)
Non-Equity
Incentive Plan
Comp.(4)
Change in
Pension
Value and
Non-qualified
Deferred
Comp.
Earnings(5)
All Other
Comp.(6)
Total
2010
$1,096,168
—
$1,701,290
$0
$341,000
$2,259,538
$320,194
$5,718,190
2009
988,660
—
6,181,534
1,050,000
1,705,000
2,468,046
232,079
12,625,319
A.M. Perez
Chairman &
CEO
2008
1,096,168
—
2,321,282
683,901
0
3,438,295
285,442
7,825,088
A.P.
McCorvey(7)
SVP & CFO
2010
312,093
—
0
41,850
47,733
58,007
16,399
476,082
2010
697,561
—
0
0
119,000
595,728
4,221
1,416,510
2009
651,950
—
2,029,519
630,000
595,000
692,301
748
4,599,518
P.J. Faraci
President &
COO
2008
697,561
—
1,300,992
224,543
0
341,208
27,947
2,592,251
P. Jotwani(8)
SVP & CMO
2010
135,680
—
396,000
535,000
23,425
5,321
0
1,095,426
2010
459,593
—
0
0
59,956
382,347
1,531,272
2,433,168
J.P. Haag
SVP & GC
2009
429,537
—
769,120
0
299,780
478,878
6,693
1,984,008
Former Executive
2010
528,921
—
0
0
0
0
7,825
536,746
2009
558,811
—
1,709,116
0
450,000
191,801
773
2,910,502
F.S.
Sklarsky(9)
Former EVP
& CFO
2008
597,911
—
641,885
189,098
0
119,720
10,369
1,558,983
(1) This column reports the base salary earned by each of our Named Executive Officers. See pages 40 – 41 of this Proxy Statement
for a discussion and analysis of base salary levels.
(2) This column reports the grant date fair value (as calculated for financial reporting purposes), without any reduction for risk of
forfeiture, for all stock awards (including Leadership Stock, Restricted Stock and RSUs) granted during each year reported. The
Committee did not award an annual equity grant in 2010 consistent with the intent disclosed in our 2010 proxy statement. The
values in this column represent Mr. Perez's 2010 performance stock unit award under his individual letter agreement, which
defined an intended value of $1.23 million. This value was converted to shares using the 10-day closing price of Kodak stock up to
the date the shares were issued on January 4, 2010 ($4.28) rounded to the nearest ten shares. Since the Committee approved
the performance share metrics at the February 22, 2010 meeting, the value of the award was established on that date in
accordance with Accounting Standards Codification Topic 718 utilizing the then current stock price of $5.92. On March 16, 2011,
the Committee certified an award payment of 86.3%, representing 248,009 shares worth $734,107 based on the closing price on
that date. Mr. Jotwani's value represents his October 2010 new hire restricted stock unit award.
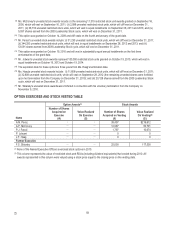
(3) This column reports the grant date fair value (as calculated for financial reporting purposes), without any reduction for risk of
forfeiture, for all stock option awards granted during each year reported. The Committee did not award an annual equity grant in
2010 consistent with the intent disclosed in the 2010 proxy statement. The values in this column represent (1) Mr. Jotwani’s
October 2010 new hire stock option award and (2) Ms. McCorvey’s December 2010 stock option award, granted in connection
with her promotion to CFO. Refer to the Grants of Plan Based of Awards Table for additional details. The assumptions used to
calculate the values of the awards are the same as those used for our stock-based compensation disclosure in Note 20 to our
financial statements in our Annual Report on Form 10-K for the year ended December 31, 2010, as filed with the SEC on February
25, 2011. The following table includes the assumptions used to calculate the grant date fair value of stock options granted in 2008,
2009 and 2010.