Kodak 2010 Annual Report Download - page 81
Download and view the complete annual report
Please find page 81 of the 2010 Kodak annual report below. You can navigate through the pages in the report by either clicking on the pages listed below, or by using the keyword search tool below to find specific information within the annual report.-
 1
1 -
2
-
3
-
4
-
5
-
6
-
7
-
8
-
9
-
10
-
11
-
12
-
13
-
14
-
15
-
16
-
17
-
18
-
19
-
20
-
21
-
22
-
23
-
24
-
25
-
26
-
27
-
28
-
29
-
30
-
31
-
32
-
33
-
34
-
35
-
36
-
37
-
38
-
39
-
40
-
41
-
42
-
43
-
44
-
45
-
46
-
47
-
48
-
49
-
50
-
51
-
52
-
53
-
54
-
55
-
56
-
57
-
58
-
59
-
60
-
61
-
62
-
63
-
64
-
65
-
66
-
67
-
68
-
69
-
70
-
 71
71 -
 72
72 -
 73
73 -
 74
74 -
 75
75 -
 76
76 -
 77
77 -
 78
78 -
 79
79 -
 80
80 -
 81
81 -
 82
82 -
 83
83 -
 84
84 -
 85
85 -
 86
86 -
 87
87 -
 88
88 -
 89
89 -
 90
90 -
 91
91 -
92
-
93
-
94
-
95
-
96
-
97
-
98
-
99
-
100
-
101
-
102
-
103
-
104
-
105
-
106
-
107
-
108
-
109
-
110
-
111
-
112
-
113
-
114
-
115
-
116
-
117
-
118
-
119
-
120
-
121
-
122
-
123
-
124
-
125
-
126
-
127
-
128
-
129
-
130
-
131
-
132
-
133
-
134
-
135
-
136
-
137
-
138
-
139
-
140
-
141
-
142
-
143
-
144
-
145
-
146
-
147
-
148
-
149
-
150
-
151
-
152
-
153
-
154
-
155
-
156
-
157
-
158
-
159
-
160
-
161
-
162
-
163
-
164
-
165
-
166
-
167
-
168
-
169
-
170
-
171
-
172
-
173
-
174
-
175
-
176
-
177
-
178
-
179
-
180
-
181
-
182
-
183
-
184
-
185
-
186
-
187
-
188
-
189
-
190
-
191
-
192
-
193
-
194
-
195
-
196
-
197
-
198
-
199
-
200
-
201
-
202
-
203
-
204
-
205
-
206
-
207
-
208
 |
 |

79
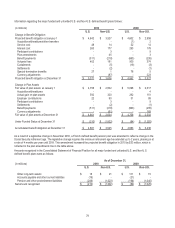
Information regarding the major funded and unfunded U.S. and Non-U.S. defined benefit plans follows:
(in millions)
2010
2009
U.S.
Non-U.S.
U.S.
Non-U.S.
Change in Benefit Obligation
Projected benefit obligation at January 1
$ 4,842
$ 3,527
$ 4,602
$ 2,958
Acquisitions/divestitures/other transfers
-
-
(1)
2
Service cost
48
14
52
14
Interest cost
263
177
293
178
Participant contributions
-
3
-
9
Plan amendments
-
45
-
3
Benefit payments
(511)
(218)
(663)
(235)
Actuarial loss
402
181
500
374
Curtailments
-
(5)
(19)
(3)
Settlements
-
(2)
-
(1)
Special termination benefits
27
1
78
5
Currency adjustments
-
(87)
-
223
Projected benefit obligation at December 31
$ 5,071
$ 3,636
$ 4,842
$ 3,527
Change in Plan Assets
Fair value of plan assets at January 1
$ 4,758
$ 2,502
$ 5,098
$ 2,317
Acquisitions/divestitures
-
-
-
4
Actual gain on plan assets
592
320
292
151
Employer contributions
22
90
31
88
Participant contributions
-
3
-
9
Settlements
-
(2)
-
(1)
Benefit payments
(511)
(218)
(663)
(235)
Currency adjustments
-
(61)
-
169
Fair value of plan assets at December 31
$ 4,861
$ 2,634
$ 4,758
$ 2,502
Under Funded Status at December 31
$ (210)
$ (1,002)
$ (84)
$ (1,025)
Accumulated benefit obligation at December 31
$ 4,881
$ 3,545
$ 4,683
$ 3,436
As a result of a legislative change in November 2010, a French defined benefit pension plan was amended to reflect a change in the
Social Security retirement age. The legislative change requires the minimum retirement age be extended up to 2 years, phasing in at
a rate of 4 months per year until 2018. This amendment increased the projected benefit obligation in 2010 by $33 million, which is
reflected in the plan amendments line in the table above.
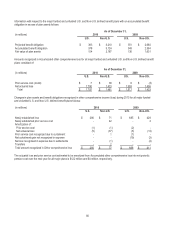
Amounts recognized in the Consolidated Statement of Financial Position for all major funded and unfunded U.S. and Non-U.S.
defined benefit plans were as follows:
As of December 31,
(in millions)
2010
2009
U.S.
Non-U.S.
U.S.
Non-U.S.
Other long-term assets
$ 18
$ 21
$ 131
$ 15
Accounts payable and other current liabilities
(19)
-
(21)
-
Pension and other postretirement liabilities
(209)
(1,023)
(194)
(1,040)
Net amount recognized
$ (210)
$ (1,002)
$ (84)
$ (1,025)