Kodak 2010 Annual Report Download - page 28
Download and view the complete annual report
Please find page 28 of the 2010 Kodak annual report below. You can navigate through the pages in the report by either clicking on the pages listed below, or by using the keyword search tool below to find specific information within the annual report.-
 1
1 -
2
-
3
-
4
-
5
-
6
-
7
-
8
-
9
-
10
-
11
-
12
-
13
-
14
-
15
-
16
-
17
-
 18
18 -
 19
19 -
 20
20 -
 21
21 -
 22
22 -
 23
23 -
 24
24 -
 25
25 -
 26
26 -
 27
27 -
 28
28 -
 29
29 -
 30
30 -
 31
31 -
 32
32 -
 33
33 -
 34
34 -
 35
35 -
 36
36 -
 37
37 -
 38
38 -
39
-
40
-
41
-
42
-
43
-
44
-
45
-
46
-
47
-
48
-
49
-
50
-
51
-
52
-
53
-
54
-
55
-
56
-
57
-
58
-
59
-
60
-
61
-
62
-
63
-
64
-
65
-
66
-
67
-
68
-
69
-
70
-
71
-
72
-
73
-
74
-
75
-
76
-
77
-
78
-
79
-
80
-
81
-
82
-
83
-
84
-
85
-
86
-
87
-
88
-
89
-
90
-
91
-
92
-
93
-
94
-
95
-
96
-
97
-
98
-
99
-
100
-
101
-
102
-
103
-
104
-
105
-
106
-
107
-
108
-
109
-
110
-
111
-
112
-
113
-
114
-
115
-
116
-
117
-
118
-
119
-
120
-
121
-
122
-
123
-
124
-
125
-
126
-
127
-
128
-
129
-
130
-
131
-
132
-
133
-
134
-
135
-
136
-
137
-
138
-
139
-
140
-
141
-
142
-
143
-
144
-
145
-
146
-
147
-
148
-
149
-
150
-
151
-
152
-
153
-
154
-
155
-
156
-
157
-
158
-
159
-
160
-
161
-
162
-
163
-
164
-
165
-
166
-
167
-
168
-
169
-
170
-
171
-
172
-
173
-
174
-
175
-
176
-
177
-
178
-
179
-
180
-
181
-
182
-
183
-
184
-
185
-
186
-
187
-
188
-
189
-
190
-
191
-
192
-
193
-
194
-
195
-
196
-
197
-
198
-
199
-
200
-
201
-
202
-
203
-
204
-
205
-
206
-
207
-
208
 |
 |

26
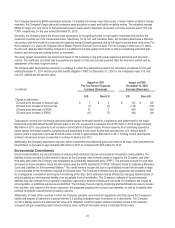
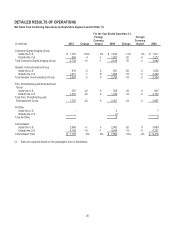
DETAILED RESULTS OF OPERATIONS
Net Sales from Continuing Operations by Reportable Segment and All Other (1)
For the Year Ended December 31,
(in millions)
2010
Change
Foreign
Currency
Impact
2009
Change
Foreign
Currency
Impact
2008
Consumer Digital Imaging Group
Inside the U.S.
$ 1,781
+10%
0%
$ 1,618
-11%
0%
$ 1,811
Outside the U.S.
958
-4
-2
1,001
-22
-4
1,277
Total Consumer Digital Imaging Group
2,739
+5
-1
2,619
-15
-2
3,088
Graphic Communications Group
Inside the U.S.
810
-3
0
831
-20
0
1,036
Outside the U.S.
1,871
-1
0
1,895
-18
-3
2,298
Total Graphic Communications Group
2,681
-2
0
2,726
-18
-2
3,334
Film, Photofinishing and Entertainment
Group
Inside the U.S.
397
-22
0
508
-39
0
835
Outside the U.S.
1,370
-22
0
1,749
-19
-4
2,152
Total Film, Photofinishing and
Entertainment Group
1,767
-22
0
2,257
-24
-3
2,987
All Other
Inside the U.S.
-
5
7
Outside the U.S.
-
(1)
-
Total All Other
-
4
7
Consolidated
Inside the U.S.
2,988
+1
0
2,962
-20
0
3,689
Outside the U.S.
4,199
-10
-1
4,644
-19
-4
5,727
Consolidated Total
$ 7,187
-6%
0%
$ 7,606
-19%
-2%
$ 9,416
(1) Sales are reported based on the geographic area of destination.