Kodak 2010 Annual Report Download - page 26
Download and view the complete annual report
Please find page 26 of the 2010 Kodak annual report below. You can navigate through the pages in the report by either clicking on the pages listed below, or by using the keyword search tool below to find specific information within the annual report.-
 1
1 -
2
-
3
-
4
-
5
-
6
-
7
-
8
-
9
-
10
-
11
-
12
-
13
-
14
-
15
-
 16
16 -
 17
17 -
 18
18 -
 19
19 -
 20
20 -
 21
21 -
 22
22 -
 23
23 -
 24
24 -
 25
25 -
 26
26 -
 27
27 -
 28
28 -
 29
29 -
 30
30 -
 31
31 -
 32
32 -
 33
33 -
 34
34 -
 35
35 -
 36
36 -
37
-
38
-
39
-
40
-
41
-
42
-
43
-
44
-
45
-
46
-
47
-
48
-
49
-
50
-
51
-
52
-
53
-
54
-
55
-
56
-
57
-
58
-
59
-
60
-
61
-
62
-
63
-
64
-
65
-
66
-
67
-
68
-
69
-
70
-
71
-
72
-
73
-
74
-
75
-
76
-
77
-
78
-
79
-
80
-
81
-
82
-
83
-
84
-
85
-
86
-
87
-
88
-
89
-
90
-
91
-
92
-
93
-
94
-
95
-
96
-
97
-
98
-
99
-
100
-
101
-
102
-
103
-
104
-
105
-
106
-
107
-
108
-
109
-
110
-
111
-
112
-
113
-
114
-
115
-
116
-
117
-
118
-
119
-
120
-
121
-
122
-
123
-
124
-
125
-
126
-
127
-
128
-
129
-
130
-
131
-
132
-
133
-
134
-
135
-
136
-
137
-
138
-
139
-
140
-
141
-
142
-
143
-
144
-
145
-
146
-
147
-
148
-
149
-
150
-
151
-
152
-
153
-
154
-
155
-
156
-
157
-
158
-
159
-
160
-
161
-
162
-
163
-
164
-
165
-
166
-
167
-
168
-
169
-
170
-
171
-
172
-
173
-
174
-
175
-
176
-
177
-
178
-
179
-
180
-
181
-
182
-
183
-
184
-
185
-
186
-
187
-
188
-
189
-
190
-
191
-
192
-
193
-
194
-
195
-
196
-
197
-
198
-
199
-
200
-
201
-
202
-
203
-
204
-
205
-
206
-
207
-
208
 |
 |

24
The Company reviews its EROA assumption annually. To facilitate this review, every three years, or when market conditions change
materially, the Company’s larger plans will undertake asset allocation or asset and liability modeling studies. The weighted average
EROA for major U.S. and non-U.S. defined benefit pension plans used to determine net pension (income) expense was 8.73% and
7.76%, respectively, for the year ended December 31, 2010.
Generally, the Company bases the discount rate assumption for its significant plans on high quality corporate bond yields in the
respective countries as of the measurement date. Specifically, for its U.S. and Canadian plans, the Company determines a discount
rate using a cash flow model to incorporate the expected timing of benefit payments and an AA-rated corporate bond yield curve. For
the Company's U.S. plans, the Citigroup Above Median Pension Discount Curve is used. For the Company’s other non-U.S. plans,
the discount rates are determined by comparison to published local high quality bond yields or indices considering estimated plan
duration and removing any outlying bonds, as warranted.
The salary growth assumptions are determined based on the Company’s long-term actual experience and future and near-term
outlook. The healthcare cost trend rate assumptions are based on historical cost and payment data, the near-term outlook and an
assessment of the likely long-term trends.
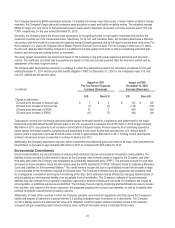
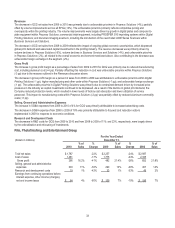
The following table illustrates the sensitivity to a change to certain key assumptions used in the calculation of expense for the year
ending December 31, 2011 and the projected benefit obligation (“PBO”) at December 31, 2010 for the Company's major U.S. and
non-U.S. defined benefit pension plans:
(in millions)
Impact on 2011
Pre-Tax Pension Expense
Increase (Decrease)
Impact on PBO
December 31, 2010
Increase (Decrease)
U.S.
Non-U.S.
U.S.
Non-U.S.
Change in assumption:
25 basis point decrease in discount rate
$ 7
$ 4
$ 123
$ 126
25 basis point increase in discount rate
(7)
(4)
(118)
(119)
25 basis point decrease in EROA
13
7
N/A
N/A
25 basis point increase in EROA
(13)
(7)
N/A
N/A
Total pension income from continuing operations before special termination benefits, curtailments, and settlements for the major
funded and unfunded defined benefit pension plans in the U.S. is expected to decrease from $158 million in 2010 to approximately
$60 million in 2011, due primarily to an increase in amortization of actuarial losses. Pension expense from continuing operations
before special termination benefits, curtailments and settlements for the major funded and unfunded non-U.S. defined benefit
pension plans is projected to increase from $19 million in 2010 to approximately $40 million in 2011. Holding current assumptions
constant, net pension income is expected to continue to decline into 2012.
Additionally, the Company expects the expense, before curtailment and settlement gains and losses of its major other postretirement
benefit plans, to decrease to approximately $20 million in 2011 as compared with $25 million for 2010.
Environmental Commitments
Environmental liabilities are accrued based on undiscounted estimates of known environmental remediation responsibilities. The
liabilities include accruals for sites owned or leased by the Company, sites formerly owned or leased by the Company, and other
third party sites where the Company was designated as a potentially responsible party (“PRP”). The amounts accrued for such sites
are based on these estimates, which are determined using the ASTM Standard E 2137-06, “Standard Guide for Estimating Monetary
Costs and Liabilities for Environmental Matters.” The overall method includes the use of a probabilistic model that forecasts a range
of cost estimates for the remediation required at individual sites. The Company’s estimate includes equipment and operating costs
for investigations, remediation and long-term monitoring of the sites. Such estimates may be affected by changing determinations of
what constitutes an environmental liability or an acceptable level of remediation. The Company’s estimate of its environmental
liabilities may also change if the proposals to regulatory agencies for desired methods and outcomes of remediation are viewed as
not acceptable, or additional exposures are identified. The Company has an ongoing monitoring and identification process to assess
how activities, with respect to the known exposures, are progressing against the accrued cost estimates, as well as to identify other
potential remediation issues that are presently unknown.
Additionally, in many of the countries in which the Company operates, environmental regulations exist that require the Company to
handle and dispose of asbestos in a special manner if a building undergoes major renovations or is demolished. The Company
records a liability equal to the estimated fair value of its obligation to perform asset retirement activities related to the asbestos,
computed using an expected present value technique, when sufficient information exists to calculate the fair value.