Kodak 2010 Annual Report Download - page 168
Download and view the complete annual report
Please find page 168 of the 2010 Kodak annual report below. You can navigate through the pages in the report by either clicking on the pages listed below, or by using the keyword search tool below to find specific information within the annual report.-
 1
1 -
2
-
3
-
4
-
5
-
6
-
7
-
8
-
9
-
10
-
11
-
12
-
13
-
14
-
15
-
16
-
17
-
18
-
19
-
20
-
21
-
22
-
23
-
24
-
25
-
26
-
27
-
28
-
29
-
30
-
31
-
32
-
33
-
34
-
35
-
36
-
37
-
38
-
39
-
40
-
41
-
42
-
43
-
44
-
45
-
46
-
47
-
48
-
49
-
50
-
51
-
52
-
53
-
54
-
55
-
56
-
57
-
58
-
59
-
60
-
61
-
62
-
63
-
64
-
65
-
66
-
67
-
68
-
69
-
70
-
71
-
72
-
73
-
74
-
75
-
76
-
77
-
78
-
79
-
80
-
81
-
82
-
83
-
84
-
85
-
86
-
87
-
88
-
89
-
90
-
91
-
92
-
93
-
94
-
95
-
96
-
97
-
98
-
99
-
100
-
101
-
102
-
103
-
104
-
105
-
106
-
107
-
108
-
109
-
110
-
111
-
112
-
113
-
114
-
115
-
116
-
117
-
118
-
119
-
120
-
121
-
122
-
123
-
124
-
125
-
126
-
127
-
128
-
129
-
130
-
131
-
132
-
133
-
134
-
135
-
136
-
137
-
138
-
139
-
140
-
141
-
142
-
143
-
144
-
145
-
146
-
147
-
148
-
149
-
150
-
151
-
152
-
153
-
154
-
155
-
156
-
157
-
 158
158 -
 159
159 -
 160
160 -
 161
161 -
 162
162 -
 163
163 -
 164
164 -
 165
165 -
 166
166 -
 167
167 -
 168
168 -
 169
169 -
 170
170 -
 171
171 -
 172
172 -
 173
173 -
 174
174 -
 175
175 -
 176
176 -
 177
177 -
 178
178 -
179
-
180
-
181
-
182
-
183
-
184
-
185
-
186
-
187
-
188
-
189
-
190
-
191
-
192
-
193
-
194
-
195
-
196
-
197
-
198
-
199
-
200
-
201
-
202
-
203
-
204
-
205
-
206
-
207
-
208
 |
 |

42
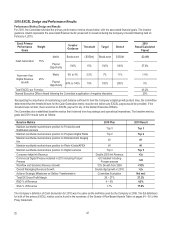
2010 EXCEL Design and Performance Results
Performance Metrics Design and Results
For 2010, the Committee selected the primary performance metrics shown below, with the associated financial goals. The investor
guidance column represents the associated financial metric presented to investors during the Company’s Investor Meeting held on
February 4, 2010.
Excel Primary
Performance
Goals
Weight
Investor
Guidance
Threshold
Target
Stretch
2010
Result/Calculated
Payout
Metric
Break-even
(-$350m)
Break-even
$350M
-$248M
Cash Generation
75%
Payout
Opportunity
100%
10%
100%
190%
57.6%
Metric
5% to 9%
2.5%
7%
11%
1.4%
Year-over-Year
Digital Revenue
Growth
25%
Payout
Opportunity
60% to 140%
10%
100%
200%
0%
Total EXCEL per Formula:
43.2%
Named Executive Officer Award following the Committee’s application of negative discretion:
20%
Recognizing the importance of maintaining a cash balance sufficient to fund the Company’s digital growth product lines, the Committee
determined that the threshold level for the Cash Generation metric must be met before any EXCEL payout would be provided. If the
threshold was not met, there would be no EXCEL payout for any of the Named Executive Officers.
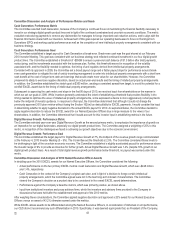
The Committee also established baseline metrics that it derived from key strategic and operational imperatives. The baseline metrics,
goals and 2010 results were as follows:
Baseline Metrics
2010 Plan
2010 Result
Maintain worldwide market share position for Production and
Distributed scanners
Top 3
Top 3
Maintain worldwide market share position for Prepress Digital Plates
Top 2
Top 2
Maintain worldwide market share position for Entertainment Imaging
film
#1
#1
Maintain worldwide market share position for Photo Kiosks/APEX
#1
#1
Maintain worldwide market share position for Digital Cameras
Top 4
Top 5
Consumer Inkjet Ink Revenue
Double 2009 Ink Revenue
<2x
Commercial Digital Presses installed in 2010 including Prosper
Presses
>20 installed including
Prosper presses
>20
Workflow and Solutions Revenue Growth
10% Growth from 2009
<10%
Overall Packaging Revenue Growth
Double digit growth in 2010
>2x
Achieve Strategic Milestones on Gallery Transformation
Committee Evaluation
Not met
Total EK Gross Profit Margin
26 – 27%
27.3%
R&D % of Revenue
4 – 5%
4.5%
SGA % of Revenue
17%
17.8%
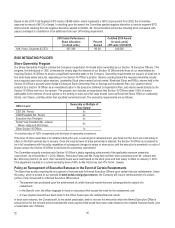
The Company’s definition of Cash Generation for 2010 was the same as the definition used by the Company in 2009. The full definitions
for both of the primary EXCEL metrics can be found in the narratives of the Grants of Plan-Based Awards Table on pages 54 – 55 of this
Proxy Statement.