Kodak 2010 Annual Report Download - page 49
Download and view the complete annual report
Please find page 49 of the 2010 Kodak annual report below. You can navigate through the pages in the report by either clicking on the pages listed below, or by using the keyword search tool below to find specific information within the annual report.-
 1
1 -
2
-
3
-
4
-
5
-
6
-
7
-
8
-
9
-
10
-
11
-
12
-
13
-
14
-
15
-
16
-
17
-
18
-
19
-
20
-
21
-
22
-
23
-
24
-
25
-
26
-
27
-
28
-
29
-
30
-
31
-
32
-
33
-
34
-
35
-
36
-
37
-
38
-
 39
39 -
 40
40 -
 41
41 -
 42
42 -
 43
43 -
 44
44 -
 45
45 -
 46
46 -
 47
47 -
 48
48 -
 49
49 -
 50
50 -
 51
51 -
 52
52 -
 53
53 -
 54
54 -
 55
55 -
 56
56 -
 57
57 -
 58
58 -
 59
59 -
60
-
61
-
62
-
63
-
64
-
65
-
66
-
67
-
68
-
69
-
70
-
71
-
72
-
73
-
74
-
75
-
76
-
77
-
78
-
79
-
80
-
81
-
82
-
83
-
84
-
85
-
86
-
87
-
88
-
89
-
90
-
91
-
92
-
93
-
94
-
95
-
96
-
97
-
98
-
99
-
100
-
101
-
102
-
103
-
104
-
105
-
106
-
107
-
108
-
109
-
110
-
111
-
112
-
113
-
114
-
115
-
116
-
117
-
118
-
119
-
120
-
121
-
122
-
123
-
124
-
125
-
126
-
127
-
128
-
129
-
130
-
131
-
132
-
133
-
134
-
135
-
136
-
137
-
138
-
139
-
140
-
141
-
142
-
143
-
144
-
145
-
146
-
147
-
148
-
149
-
150
-
151
-
152
-
153
-
154
-
155
-
156
-
157
-
158
-
159
-
160
-
161
-
162
-
163
-
164
-
165
-
166
-
167
-
168
-
169
-
170
-
171
-
172
-
173
-
174
-
175
-
176
-
177
-
178
-
179
-
180
-
181
-
182
-
183
-
184
-
185
-
186
-
187
-
188
-
189
-
190
-
191
-
192
-
193
-
194
-
195
-
196
-
197
-
198
-
199
-
200
-
201
-
202
-
203
-
204
-
205
-
206
-
207
-
208
 |
 |

47
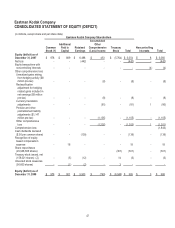
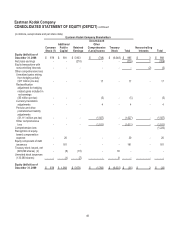
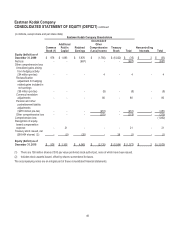
Eastman Kodak Company
CONSOLIDATED STATEMENT OF EQUITY (DEFICIT)
(in millions, except share and per share data)
Eastman Kodak Company Shareholders
Accumulated
Additional
Other
Common
Paid In
Retained
Comprehensive
Treasury
Noncontrolling
Stock (1)
Capital
Earnings
(Loss) Income
Stock
Total
Interests
Total
Equity (deficit) as of
December 31, 2007
$ 978
$ 889
$ 6,498
$ 453
$ (5,764)
$ 3,054
$ 6
$ 3,060
Net loss
-
-
(442)
-
-
(442)
-
(442)
Equity transactions with
noncontrolling interests
-
-
-
-
-
-
(4)
(4)
Other comprehensive loss:
Unrealized gains arising
from hedging activity ($8
million pre-tax)
-
-
-
(8)
-
(8)
-
(8)
Reclassification
adjustment for hedging
related gains included in
net earnings ($8 million
pre-tax)
-
-
-
(8)
-
(8)
-
(8)
Currency translation
adjustments
-
-
-
(81)
-
(81)
1
(80)
Pension and other
postretirement liability
adjustments ($1,147
million pre-tax)
-
-
-
(1,105)
-
(1,105)
-
(1,105)
Other comprehensive
loss
-
-
-
(1,202)
-
(1,202)
1
(1,201)
Comprehensive loss
(1,643)
Cash dividends declared
($.50 per common share)
-
-
(139)
-
-
(139)
-
(139)
Recognition of equity-
based compensation
expense
-
18
-
-
-
18
-
18
Share repurchases
(20,046,396 shares)
(301)
(301)
-
(301)
Treasury stock issued, net
(159,021 shares) (2)
-
(5)
(12)
-
14
(3)
-
(3)
Unvested stock issuances
(56,600 shares)
-
(1)
(2)
-
3
-
-
-
Equity (deficit) as of
December 31, 2008
$ 978
$ 901
$ 5,903
$ (749)
$ (6,048)
$ 985
$ 3
$ 988