Kodak 2010 Annual Report Download - page 61
Download and view the complete annual report
Please find page 61 of the 2010 Kodak annual report below. You can navigate through the pages in the report by either clicking on the pages listed below, or by using the keyword search tool below to find specific information within the annual report.-
 1
1 -
2
-
3
-
4
-
5
-
6
-
7
-
8
-
9
-
10
-
11
-
12
-
13
-
14
-
15
-
16
-
17
-
18
-
19
-
20
-
21
-
22
-
23
-
24
-
25
-
26
-
27
-
28
-
29
-
30
-
31
-
32
-
33
-
34
-
35
-
36
-
37
-
38
-
39
-
40
-
41
-
42
-
43
-
44
-
45
-
46
-
47
-
48
-
49
-
50
-
 51
51 -
 52
52 -
 53
53 -
 54
54 -
 55
55 -
 56
56 -
 57
57 -
 58
58 -
 59
59 -
 60
60 -
 61
61 -
 62
62 -
 63
63 -
 64
64 -
 65
65 -
 66
66 -
 67
67 -
 68
68 -
 69
69 -
 70
70 -
 71
71 -
72
-
73
-
74
-
75
-
76
-
77
-
78
-
79
-
80
-
81
-
82
-
83
-
84
-
85
-
86
-
87
-
88
-
89
-
90
-
91
-
92
-
93
-
94
-
95
-
96
-
97
-
98
-
99
-
100
-
101
-
102
-
103
-
104
-
105
-
106
-
107
-
108
-
109
-
110
-
111
-
112
-
113
-
114
-
115
-
116
-
117
-
118
-
119
-
120
-
121
-
122
-
123
-
124
-
125
-
126
-
127
-
128
-
129
-
130
-
131
-
132
-
133
-
134
-
135
-
136
-
137
-
138
-
139
-
140
-
141
-
142
-
143
-
144
-
145
-
146
-
147
-
148
-
149
-
150
-
151
-
152
-
153
-
154
-
155
-
156
-
157
-
158
-
159
-
160
-
161
-
162
-
163
-
164
-
165
-
166
-
167
-
168
-
169
-
170
-
171
-
172
-
173
-
174
-
175
-
176
-
177
-
178
-
179
-
180
-
181
-
182
-
183
-
184
-
185
-
186
-
187
-
188
-
189
-
190
-
191
-
192
-
193
-
194
-
195
-
196
-
197
-
198
-
199
-
200
-
201
-
202
-
203
-
204
-
205
-
206
-
207
-
208
 |
 |

59
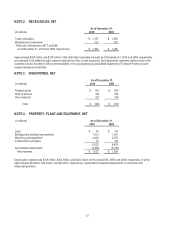
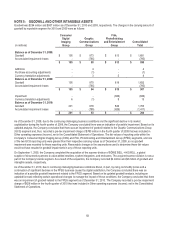
The gross carrying amount and accumulated amortization by major intangible asset category as of December 31, 2010 and 2009
were as follows:
As of December 31, 2010
Gross Carrying
Accumulated
Weighted-Average
(in millions)
Amount
Amortization
Net
Amortization Period
Technology-based
$ 168
$ 135
$ 33
7 years
Customer-related
256
177
79
11 years
Other
29
17
12
14 years
Total
$ 453
$ 329
$124
10 years
As of December 31, 2009
Gross Carrying
Accumulated
Weighted-Average
(in millions)
Amount
Amortization
Net
Amortization Period
Technology-based
$ 309
$ 241
$ 68
7 years
Customer-related
273
173
100
10 years
Other
64
48
16
11 years
Total
$ 646
$ 462
$184
9 years
Amortization expense related to intangible assets was $60 million, $73 million, and $80 million for the years ended December 31,
2010, 2009, and 2008, respectively.
Estimated future amortization expense related to purchased intangible assets as of December 31, 2010 was as follows (in millions):
2011
$ 39
2012
26
2013
13
2014
10
2015
10
2016+
26
Total
$ 124
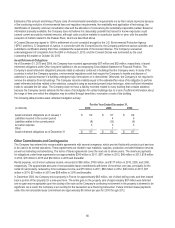
NOTE 6: OTHER LONG-TERM ASSETS
As of December 31,
(in millions)
2010
2009
Overfunded pension plans
$ 48
$ 169
Deferred income taxes, net of valuation allowance
695
607
Intangible assets
124
184
Other
242
267
Total
$ 1,109
$ 1,227
The Other component above consists of other miscellaneous long-term assets that, individually, were less than 5% of the
Company’s total assets in the accompanying Consolidated Statement of Financial Position, and therefore, have been aggregated in
accordance with Regulation S-X.