Kodak 2010 Annual Report Download - page 169
Download and view the complete annual report
Please find page 169 of the 2010 Kodak annual report below. You can navigate through the pages in the report by either clicking on the pages listed below, or by using the keyword search tool below to find specific information within the annual report.-
 1
1 -
2
-
3
-
4
-
5
-
6
-
7
-
8
-
9
-
10
-
11
-
12
-
13
-
14
-
15
-
16
-
17
-
18
-
19
-
20
-
21
-
22
-
23
-
24
-
25
-
26
-
27
-
28
-
29
-
30
-
31
-
32
-
33
-
34
-
35
-
36
-
37
-
38
-
39
-
40
-
41
-
42
-
43
-
44
-
45
-
46
-
47
-
48
-
49
-
50
-
51
-
52
-
53
-
54
-
55
-
56
-
57
-
58
-
59
-
60
-
61
-
62
-
63
-
64
-
65
-
66
-
67
-
68
-
69
-
70
-
71
-
72
-
73
-
74
-
75
-
76
-
77
-
78
-
79
-
80
-
81
-
82
-
83
-
84
-
85
-
86
-
87
-
88
-
89
-
90
-
91
-
92
-
93
-
94
-
95
-
96
-
97
-
98
-
99
-
100
-
101
-
102
-
103
-
104
-
105
-
106
-
107
-
108
-
109
-
110
-
111
-
112
-
113
-
114
-
115
-
116
-
117
-
118
-
119
-
120
-
121
-
122
-
123
-
124
-
125
-
126
-
127
-
128
-
129
-
130
-
131
-
132
-
133
-
134
-
135
-
136
-
137
-
138
-
139
-
140
-
141
-
142
-
143
-
144
-
145
-
146
-
147
-
148
-
149
-
150
-
151
-
152
-
153
-
154
-
155
-
156
-
157
-
158
-
 159
159 -
 160
160 -
 161
161 -
 162
162 -
 163
163 -
 164
164 -
 165
165 -
 166
166 -
 167
167 -
 168
168 -
 169
169 -
 170
170 -
 171
171 -
 172
172 -
 173
173 -
 174
174 -
 175
175 -
 176
176 -
 177
177 -
 178
178 -
 179
179 -
180
-
181
-
182
-
183
-
184
-
185
-
186
-
187
-
188
-
189
-
190
-
191
-
192
-
193
-
194
-
195
-
196
-
197
-
198
-
199
-
200
-
201
-
202
-
203
-
204
-
205
-
206
-
207
-
208
 |
 |
43
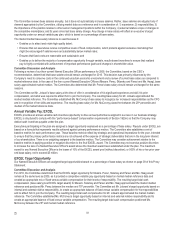
Committee Discussion and Analysis of Performance Metrics and Goals
Cash Generation: Performance Metric
The Committee selected Cash Generation, because of the Company’s continued focus on maintaining the financial flexibility necessary to
invest in our strategic digital growth product lines and in light of the continued constrained and uncertain economic conditions. The metric
excluded restructuring payments to remove any disincentive for managers to forego important cost reduction actions, and to align with the
financial information shared with our investors. Achievement of this goal required our operating businesses to focus on Earnings from
Operations (EFO) and working capital performance as well as the completion of new intellectual property arrangements consistent with our
business strategy.
Cash Generation: Performance Goal
The Committee established a target payout for Cash Generation at break-even. Break-even cash was the goal shared at our February
2010 Investor Meeting. This goal was consistent with our business strategy and reflected continued investment in our four digital growth
product lines. The Committee established a threshold of -$350M to ensure a year-end cash balance of $1.5 billion after debt payments,
restructuring, and the investments associated with the business plan. Further, this threshold was set in recognition of the volatility
associated with, and the flexibility needed to optimize, the timing of and royalties derived from intellectual property arrangements.
Consistent with its approach in 2009, the Committee set a broad payout range and a flatter payout slope for performance around break-
even cash generation to mitigate the risk of unduly incenting management to enter into intellectual property arrangements with a short term
cash benefit at the cost of longer term cash and earnings that would create more value for our shareholders. However, the Committee
preserved its ability to exercise negative discretion, based on actual year-end results and the timing of intellectual property arrangements.
In addition, the Committee established the stretch goal at $350 million, creating a consistent spread from target, to avoid the potential for a
windfall EXCEL award due to the timing of intellectual property arrangements.
Subsequent to approving the cash metric and slope in the first 90 days of 2010, we received input from shareholders on the manner in
which we set our goals in 2009. While investors generally understood the intent of establishing a threshold that provides flexibility in the
timing needed to optimize the value of intellectual property arrangements, some expressed a desire to more aggressively curtail payments
below the midpoint of investor guidance. In response to this input, the Committee determined that although it could not change the
previously approved 2010 plan metrics without losing the Section 162(m) tax deductibility for EXCEL payments, it would consider this input
in determining whether to apply negative discretion to the actual EXCEL payout for 2010. As explained below, the Committee decided to
apply negative discretion to reduce the EXCEL award for our Named Executive Officers due in large measure to the views of our
shareholders. In addition, the Committee determined that it would account for this investor input in establishing metrics in the future.
Digital Revenue Growth: Performance Metric
The Committee selected year-over-year Digital Revenue Growth as the second primary metric, to emphasize the importance of growth as
an imperative for our digital businesses, especially our digital growth product lines. The Committee assigned a weighting of 25% to this
metric, in recognition of the challenges we faced in achieving our growth objectives due to the economic environment.
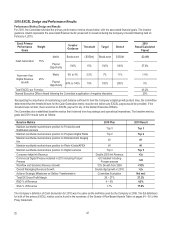
Digital Revenue Growth: Performance Goal
The Committee established the target payout for Digital Revenue Growth at 7%, the midpoint of the revenue growth range communicated
at the February 4, 2010 Investor Meeting (5 – 9%). The Committee set the threshold at 2.5%. The Committee considered these levels to
be challenging in light of the uncertain economic recovery. The Committee established a slightly accelerated payout for performance above
the investor range of 9% to provide an incentive for further growth. Actual Digital Revenue Growth was 1.4% (despite 18% growth in our
digital growth product lines). As a result of total digital revenue growth performance below threshold, no payout was earned under this
metric.
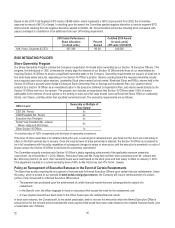
Committee Discussion and Analysis of 2010 Named Executive Officer Awards
In deciding upon the 2010 EXCEL awards for our Named Executive Officers, the Committee considered the following:
• Actual performance on the two primary EXCEL metrics: Cash Generation and Digital Revenue Growth, which was -$248 million
and 1.4%, respectively.
• Cash Generation in the context of the Company’s original cash plan, and in light of a decision to forego certain intellectual
property arrangements, which the Committee agreed were not in the best long-term interest of shareholders. The Committee
viewed the Company’s decision as a prudent step to be considered in the overall EXCEL award determinations.
• Performance against the Company’s baseline metrics, which was primarily positive, as shown above.
• Input from institutional investors and proxy advisory firms, which the investors and advisory firms provided to the Company in
discussions that were held after the establishment and approval of the 2010 metrics.
After weighing these considerations, the Committee applied negative discretion and approved a 20% award for our Named Executive
Officers versus an award of 43.2% otherwise earned under the metrics.
While EXCEL allows awards to be differentiated among the Named Executive Officers, in consideration of individual or unit performance,
our CEO did not recommend any such differentiation in 2010. Specifically, it was deemed appropriate that, as President of the Company,