Kodak 2010 Annual Report Download - page 35
Download and view the complete annual report
Please find page 35 of the 2010 Kodak annual report below. You can navigate through the pages in the report by either clicking on the pages listed below, or by using the keyword search tool below to find specific information within the annual report.-
 1
1 -
2
-
3
-
4
-
5
-
6
-
7
-
8
-
9
-
10
-
11
-
12
-
13
-
14
-
15
-
16
-
17
-
18
-
19
-
20
-
21
-
22
-
23
-
24
-
 25
25 -
 26
26 -
 27
27 -
 28
28 -
 29
29 -
 30
30 -
 31
31 -
 32
32 -
 33
33 -
 34
34 -
 35
35 -
 36
36 -
 37
37 -
 38
38 -
 39
39 -
 40
40 -
 41
41 -
 42
42 -
 43
43 -
 44
44 -
 45
45 -
46
-
47
-
48
-
49
-
50
-
51
-
52
-
53
-
54
-
55
-
56
-
57
-
58
-
59
-
60
-
61
-
62
-
63
-
64
-
65
-
66
-
67
-
68
-
69
-
70
-
71
-
72
-
73
-
74
-
75
-
76
-
77
-
78
-
79
-
80
-
81
-
82
-
83
-
84
-
85
-
86
-
87
-
88
-
89
-
90
-
91
-
92
-
93
-
94
-
95
-
96
-
97
-
98
-
99
-
100
-
101
-
102
-
103
-
104
-
105
-
106
-
107
-
108
-
109
-
110
-
111
-
112
-
113
-
114
-
115
-
116
-
117
-
118
-
119
-
120
-
121
-
122
-
123
-
124
-
125
-
126
-
127
-
128
-
129
-
130
-
131
-
132
-
133
-
134
-
135
-
136
-
137
-
138
-
139
-
140
-
141
-
142
-
143
-
144
-
145
-
146
-
147
-
148
-
149
-
150
-
151
-
152
-
153
-
154
-
155
-
156
-
157
-
158
-
159
-
160
-
161
-
162
-
163
-
164
-
165
-
166
-
167
-
168
-
169
-
170
-
171
-
172
-
173
-
174
-
175
-
176
-
177
-
178
-
179
-
180
-
181
-
182
-
183
-
184
-
185
-
186
-
187
-
188
-
189
-
190
-
191
-
192
-
193
-
194
-
195
-
196
-
197
-
198
-
199
-
200
-
201
-
202
-
203
-
204
-
205
-
206
-
207
-
208
 |
 |

33
Revenues
The decrease in GCG net sales from 2009 to 2010 was primarily due to unfavorable price/mix in Prepress Solutions (-4%), partially
offset by volume improvements across all SPGs (+3%). The unfavorable price/mix primarily reflects competitive pricing and
overcapacity within the printing industry. The volume improvements were largely driven by growth in digital plates and computer-to-
plate equipment within Prepress Solutions; commercial inkjet equipment, including PROSPER S10 imprinting systems within Digital
Printing Solutions; and document imaging scanners, including the introduction of the new Kodak i4000 Series Scanners within
Business Services and Solutions.
The decrease in GCG net sales from 2008 to 2009 reflected the impact of ongoing global economic uncertainties, which depressed
global print demand and associated capital investments in the printing industry. The revenue decreases were primarily driven by
volume declines in Prepress Solutions (-9%), volume declines in Business Services and Solutions (-4%), and unfavorable price/mix
in Prepress Solutions (-2%), all related to the overall economic environment mentioned above. Also contributing to the decrease was
unfavorable foreign exchange in the segment (-2%).
Gross Profit
The increase in gross profit margin as a percentage of sales from 2009 to 2010 for GCG was primarily due to reduced manufacturing
cost, including aluminum cost (+4 pp). Partially offsetting this reduction in cost was unfavorable price/mix within Prepress Solutions
(-3 pp) due to the reasons outlined in the Revenues discussion above.
The decrease in gross profit margin as a percent of sales from 2008 to 2009 was attributable to unfavorable price/mix within Digital
Printing Solutions (-1 pp), higher manufacturing and other costs within Prepress Solutions (-1 pp), and unfavorable foreign exchange
(-1 pp). The unfavorable price/mix in Digital Printing Solutions was primarily due to constrained demand driven by increased price
pressures in the industry as capital investments continued to be depressed. As a result of the decline in global print demand, the
Company reduced production levels, which resulted in lower levels of factory cost absorption and lower utilization of service
personnel. This impact to manufacturing costs within Prepress Solutions (-2 pp) was partially offset by reduced aluminum commodity
costs (+1 pp).
Selling, General and Administrative Expenses
The increase in SG&A expenses from 2009 to 2010 of 4% for GCG was primarily attributable to increased advertising costs.
The decrease in SG&A expenses from 2008 to 2009 of 18% was primarily attributable to focused cost reduction actions
implemented in 2009 in response to economic conditions.
Research and Development Costs
The decreases in R&D costs for GCG from 2009 to 2010 and from 2008 to 2009 of 11% and 23%, respectively, were largely driven
by the rationalization and refocusing of investments.
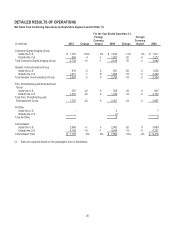
Film, Photofinishing and Entertainment Group
For the Year Ended
(dollars in millions)
December 31,
2010
% of
Sales
%
Change
2009
% of
Sales
%
Change
2008
% of
Sales
Total net sales
$ 1,767
-22%
$ 2,257
-24%
$ 2,987
Cost of sales
1,481
-17%
1,775
-24%
2,335
Gross profit
286
16.2%
-41%
482
21.4%
-26%
652
21.8%
Selling, general and administrative
expenses
203
11%
-30%
290
13%
-29%
407
14%
Research and development costs
19
1%
-42%
33
1%
-33%
49
2%
Earnings from continuing operations before
interest expense, other income (charges),
net and income taxes
$ 64
4%
-60%
$ 159
7%
-19%
$ 196
7%