Kodak 2010 Annual Report Download - page 102
Download and view the complete annual report
Please find page 102 of the 2010 Kodak annual report below. You can navigate through the pages in the report by either clicking on the pages listed below, or by using the keyword search tool below to find specific information within the annual report.-
 1
1 -
2
-
3
-
4
-
5
-
6
-
7
-
8
-
9
-
10
-
11
-
12
-
13
-
14
-
15
-
16
-
17
-
18
-
19
-
20
-
21
-
22
-
23
-
24
-
25
-
26
-
27
-
28
-
29
-
30
-
31
-
32
-
33
-
34
-
35
-
36
-
37
-
38
-
39
-
40
-
41
-
42
-
43
-
44
-
45
-
46
-
47
-
48
-
49
-
50
-
51
-
52
-
53
-
54
-
55
-
56
-
57
-
58
-
59
-
60
-
61
-
62
-
63
-
64
-
65
-
66
-
67
-
68
-
69
-
70
-
71
-
72
-
73
-
74
-
75
-
76
-
77
-
78
-
79
-
80
-
81
-
82
-
83
-
84
-
85
-
86
-
87
-
88
-
89
-
90
-
91
-
 92
92 -
 93
93 -
 94
94 -
 95
95 -
 96
96 -
 97
97 -
 98
98 -
 99
99 -
 100
100 -
 101
101 -
 102
102 -
 103
103 -
 104
104 -
 105
105 -
 106
106 -
 107
107 -
 108
108 -
 109
109 -
 110
110 -
 111
111 -
 112
112 -
113
-
114
-
115
-
116
-
117
-
118
-
119
-
120
-
121
-
122
-
123
-
124
-
125
-
126
-
127
-
128
-
129
-
130
-
131
-
132
-
133
-
134
-
135
-
136
-
137
-
138
-
139
-
140
-
141
-
142
-
143
-
144
-
145
-
146
-
147
-
148
-
149
-
150
-
151
-
152
-
153
-
154
-
155
-
156
-
157
-
158
-
159
-
160
-
161
-
162
-
163
-
164
-
165
-
166
-
167
-
168
-
169
-
170
-
171
-
172
-
173
-
174
-
175
-
176
-
177
-
178
-
179
-
180
-
181
-
182
-
183
-
184
-
185
-
186
-
187
-
188
-
189
-
190
-
191
-
192
-
193
-
194
-
195
-
196
-
197
-
198
-
199
-
200
-
201
-
202
-
203
-
204
-
205
-
206
-
207
-
208
 |
 |

100
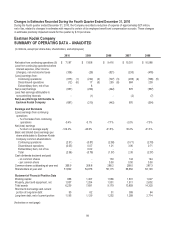
Eastman Kodak Company
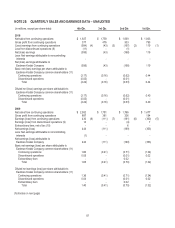
SUMMARY OF OPERATING DATA – UNAUDITED continued
(in millions, except per share data, shareholders, and employees)
2010
2009
2008
2007
2006
Supplemental Information
Net sales from continuing operations
- CDG
$ 2,739
$ 2,619
$ 3,088
$ 3,247
$ 3,013
- GCG
2,681
2,726
3,334
3,413
3,287
- FPEG
1,767
2,257
2,987
3,632
4,254
- All Other
-
4
7
9
14
Research and development costs
321
356
478
525
573
Depreciation
318
354
420
679
1,075
Taxes (excludes payroll, sales and
excise taxes) (7)
146
149
(105)
5
320
Wages, salaries and employee benefits (8)
1,572
1,732
2,141
2,846
3,480
Employees as of year end
- in the U.S. (7)
9,600
10,630
12,800
14,200
20,600
- worldwide (7)
18,800
20,250
24,400
26,900
40,900
(1) Includes a pre-tax goodwill impairment charge of $626 million; pre-tax restructuring charges of $78 million; a $102 million loss
on early extinguishment of debt; $7 million of income related to gains on assets sales; $19 million of income related to legal
contingencies and settlements; $6 million of charges related to foreign contingencies; and a net benefit of $109 million related
to other discrete tax items. These items increased net loss from continuing operations by $698 million.
(2) Includes pre-tax restructuring and rationalization charges of $258 million; a $5 million charge related to a legal settlement; $94
million of income related to gains on asset sales; $7 million of income related to the reversal of negative goodwill; $10 million of
income related to reversals of value-added tax reserves; and a $6 million asset impairment charge. These items increased net
loss from continuing operations by $138 million.
(3) Includes a pre-tax goodwill impairment charge of $785 million; pre-tax restructuring and rationalization charges of $149 million,
net of reversals; $21 million of income related to gains on sales of assets and businesses; $3 million of charges related to
asset impairments; $41 million of charges for legal contingencies and settlements; $10 million of charges for support of an
educational institution; $94 million of income related to postemployment benefit plans; $3 million of income for a foreign export
contingency; $270 million of income related to an IRS refund; and charges of $27 million related to other discrete tax items.
These items increased net loss from continuing operations by $610 million.
(4) Includes pre-tax restructuring charges of $662 million, net of reversals; $157 million of income related to property and asset
sales; $57 million of charges related to asset impairments; $6 million of charges for the establishment of a loan reserve; $9
million of charges for a foreign export contingency; and tax adjustments of $14 million. These items increased net loss from
continuing operations by $464 million.
(5) Includes pre-tax restructuring charges of $698 million, net of reversals; $2 million of income related to legal settlements; $46
million of income related to property and asset sales; and $11 million of charges related to asset impairments. These items
increased net loss by $691 million. Also included is a valuation allowance of $89 million recorded against the Company's net
deferred assets in certain jurisdictions outside the U.S., portions of which are reflected in the aforementioned net loss impact.
(6) Refer to Note 22, “Discontinued Operations” in the Notes to Financial Statements for a discussion regarding the earnings from
discontinued operations.
(7) Amounts for 2006 and prior years have not been adjusted to remove amounts associated with the Health Group.
(8) Amounts for 2007 and prior years have not been adjusted to remove wages, salaries and employee benefits associated with
the Health Group.
(9) Includes revenues from non-recurring intellectual property licensing agreements of $838 million in 2010, $435 million in 2009,
$227 million in 2008, $236 million in 2007, and $180 million in 2006.