Kodak 2010 Annual Report Download - page 38
Download and view the complete annual report
Please find page 38 of the 2010 Kodak annual report below. You can navigate through the pages in the report by either clicking on the pages listed below, or by using the keyword search tool below to find specific information within the annual report.-
 1
1 -
2
-
3
-
4
-
5
-
6
-
7
-
8
-
9
-
10
-
11
-
12
-
13
-
14
-
15
-
16
-
17
-
18
-
19
-
20
-
21
-
22
-
23
-
24
-
25
-
26
-
27
-
 28
28 -
 29
29 -
 30
30 -
 31
31 -
 32
32 -
 33
33 -
 34
34 -
 35
35 -
 36
36 -
 37
37 -
 38
38 -
 39
39 -
 40
40 -
 41
41 -
 42
42 -
 43
43 -
 44
44 -
 45
45 -
 46
46 -
 47
47 -
 48
48 -
49
-
50
-
51
-
52
-
53
-
54
-
55
-
56
-
57
-
58
-
59
-
60
-
61
-
62
-
63
-
64
-
65
-
66
-
67
-
68
-
69
-
70
-
71
-
72
-
73
-
74
-
75
-
76
-
77
-
78
-
79
-
80
-
81
-
82
-
83
-
84
-
85
-
86
-
87
-
88
-
89
-
90
-
91
-
92
-
93
-
94
-
95
-
96
-
97
-
98
-
99
-
100
-
101
-
102
-
103
-
104
-
105
-
106
-
107
-
108
-
109
-
110
-
111
-
112
-
113
-
114
-
115
-
116
-
117
-
118
-
119
-
120
-
121
-
122
-
123
-
124
-
125
-
126
-
127
-
128
-
129
-
130
-
131
-
132
-
133
-
134
-
135
-
136
-
137
-
138
-
139
-
140
-
141
-
142
-
143
-
144
-
145
-
146
-
147
-
148
-
149
-
150
-
151
-
152
-
153
-
154
-
155
-
156
-
157
-
158
-
159
-
160
-
161
-
162
-
163
-
164
-
165
-
166
-
167
-
168
-
169
-
170
-
171
-
172
-
173
-
174
-
175
-
176
-
177
-
178
-
179
-
180
-
181
-
182
-
183
-
184
-
185
-
186
-
187
-
188
-
189
-
190
-
191
-
192
-
193
-
194
-
195
-
196
-
197
-
198
-
199
-
200
-
201
-
202
-
203
-
204
-
205
-
206
-
207
-
208
 |
 |

36
2008
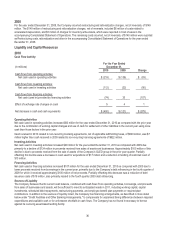
For the year ended December 31, 2008, the Company incurred restructuring and rationalization charges, net of reversals, of $149
million. The $149 million of restructuring and rationalization charges, net of reversals, included $6 million of costs related to
accelerated depreciation, and $3 million of charges for inventory write-downs, which were reported in Cost of sales in the
accompanying Consolidated Statement of Operations. The remaining costs incurred, net of reversals, of $140 million were reported
as Restructuring costs, rationalization and other in the accompanying Consolidated Statement of Operations for the year ended
December 31, 2008.
Liquidity and Capital Resources
2010
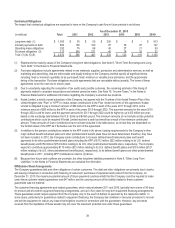
Cash Flow Activity
For the Year Ended
(in millions)
December 31,
2010
2009
Change
Cash flows from operating activities:
Net cash used in operating activities
$ (219)
$ (136)
$ (83)
Cash flows from investing activities:
Net cash used in investing activities
(112)
(22)
(90)
Cash flows from financing activities:
Net cash (used in) provided by financing activities
(74)
33
(107)
Effect of exchange rate changes on cash
5
4
1
Net decrease in cash and cash equivalents
$ (400)
$ (121)
$ (279)
Operating Activities
Net cash used in operating activities increased $83 million for the year ended December 31, 2010 as compared with the prior year
due to the combination of working capital changes and use of cash for settlement of other liabilities in the current year using more
cash than those factors in the prior year.
Cash received in 2010 related to non-recurring licensing agreements, net of applicable withholding taxes, of $629 million, was $7
million higher than cash received in 2009 related to non-recurring licensing agreements of $622 million.
Investing Activities
Net cash used in investing activities increased $90 million for the year ended December 31, 2010 as compared with 2009 due
primarily to a decline of $124 million in proceeds received from sales of assets and businesses. Approximately $100 million of this
decline is due to proceeds received from the sale of assets of the Company’s OLED group in the prior year quarter. Partially
offsetting this decline were a decrease in cash used for acquisitions of $17 million and a reduction in funding of restricted cash of
$13 million.
Financing Activities
Net cash used in financing activities increased $107 million for the year ended December 31, 2010 as compared with 2009 due to
lower proceeds received from borrowings in the current year, primarily due to the Company’s debt refinancing in the fourth quarter of
2009 for which it received approximately $100 million of net proceeds. Partially offsetting this decrease was a reduction of debt
issuance costs of $18 million, also primarily related to the fourth quarter 2009 debt refinancing.
Sources of Liquidity
The Company believes that its current cash balance, combined with cash flows from operating activities, borrowings, and proceeds
from sales of businesses and assets, will be sufficient to meet its anticipated needs in 2011, including working capital, capital
investments, scheduled debt repayments, restructuring payments, and employee benefit plan payments or required plan
contributions. In addition to the sources of liquidity noted, the Company has financing arrangements, as described in more detail
below under "Credit Facilities and Other Banking Arrangements," to compensate for unplanned timing differences between required
expenditures and available cash or for unforeseen shortfalls in cash flows. The Company has not found it necessary to borrow
against its revolving asset-based lending facility.