Kodak 2010 Annual Report Download - page 181
Download and view the complete annual report
Please find page 181 of the 2010 Kodak annual report below. You can navigate through the pages in the report by either clicking on the pages listed below, or by using the keyword search tool below to find specific information within the annual report.-
 1
1 -
2
-
3
-
4
-
5
-
6
-
7
-
8
-
9
-
10
-
11
-
12
-
13
-
14
-
15
-
16
-
17
-
18
-
19
-
20
-
21
-
22
-
23
-
24
-
25
-
26
-
27
-
28
-
29
-
30
-
31
-
32
-
33
-
34
-
35
-
36
-
37
-
38
-
39
-
40
-
41
-
42
-
43
-
44
-
45
-
46
-
47
-
48
-
49
-
50
-
51
-
52
-
53
-
54
-
55
-
56
-
57
-
58
-
59
-
60
-
61
-
62
-
63
-
64
-
65
-
66
-
67
-
68
-
69
-
70
-
71
-
72
-
73
-
74
-
75
-
76
-
77
-
78
-
79
-
80
-
81
-
82
-
83
-
84
-
85
-
86
-
87
-
88
-
89
-
90
-
91
-
92
-
93
-
94
-
95
-
96
-
97
-
98
-
99
-
100
-
101
-
102
-
103
-
104
-
105
-
106
-
107
-
108
-
109
-
110
-
111
-
112
-
113
-
114
-
115
-
116
-
117
-
118
-
119
-
120
-
121
-
122
-
123
-
124
-
125
-
126
-
127
-
128
-
129
-
130
-
131
-
132
-
133
-
134
-
135
-
136
-
137
-
138
-
139
-
140
-
141
-
142
-
143
-
144
-
145
-
146
-
147
-
148
-
149
-
150
-
151
-
152
-
153
-
154
-
155
-
156
-
157
-
158
-
159
-
160
-
161
-
162
-
163
-
164
-
165
-
166
-
167
-
168
-
169
-
170
-
 171
171 -
 172
172 -
 173
173 -
 174
174 -
 175
175 -
 176
176 -
 177
177 -
 178
178 -
 179
179 -
 180
180 -
 181
181 -
 182
182 -
 183
183 -
 184
184 -
 185
185 -
 186
186 -
 187
187 -
 188
188 -
 189
189 -
 190
190 -
 191
191 -
192
-
193
-
194
-
195
-
196
-
197
-
198
-
199
-
200
-
201
-
202
-
203
-
204
-
205
-
206
-
207
-
208
 |
 |

55
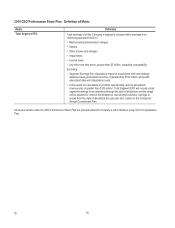
2010 CEO Performance Share Plan: Definition of Metric
Metric
Definition
Total Segment EFO
Total earnings of all the Company’s segments included within earnings from
continuing operations before:
• Restructuring/rationalization charges
• Interest
• Other income and charges
• Impairments
• Income taxes
• Any other one-time items, greater than $5 million, impacting comparability
Excluding:
• Segment Earnings from Operations impact of acquisitions and new strategic
alliances having annualized revenue of greater than $100 million, along with
associated deal and integrations costs.
• In the event of a divestiture or portfolio repositioning, with an annualized
revenue plan of greater than $100 million, Total Segment EFO will include actual
segment earnings from operations through the date of divestiture and the target
will be adjusted to remove the divested or repositioned business’ earnings or
losses from the date of divestiture through year-end, based on the Company’s
Annual Commitment Plan.
All shares earned under the CEO Performance Share Plan are granted under the Company’s 2005 Omnibus Long-Term Compensation
Plan.