Kodak 2010 Annual Report Download - page 34
Download and view the complete annual report
Please find page 34 of the 2010 Kodak annual report below. You can navigate through the pages in the report by either clicking on the pages listed below, or by using the keyword search tool below to find specific information within the annual report.-
 1
1 -
2
-
3
-
4
-
5
-
6
-
7
-
8
-
9
-
10
-
11
-
12
-
13
-
14
-
15
-
16
-
17
-
18
-
19
-
20
-
21
-
22
-
23
-
 24
24 -
 25
25 -
 26
26 -
 27
27 -
 28
28 -
 29
29 -
 30
30 -
 31
31 -
 32
32 -
 33
33 -
 34
34 -
 35
35 -
 36
36 -
 37
37 -
 38
38 -
 39
39 -
 40
40 -
 41
41 -
 42
42 -
 43
43 -
 44
44 -
45
-
46
-
47
-
48
-
49
-
50
-
51
-
52
-
53
-
54
-
55
-
56
-
57
-
58
-
59
-
60
-
61
-
62
-
63
-
64
-
65
-
66
-
67
-
68
-
69
-
70
-
71
-
72
-
73
-
74
-
75
-
76
-
77
-
78
-
79
-
80
-
81
-
82
-
83
-
84
-
85
-
86
-
87
-
88
-
89
-
90
-
91
-
92
-
93
-
94
-
95
-
96
-
97
-
98
-
99
-
100
-
101
-
102
-
103
-
104
-
105
-
106
-
107
-
108
-
109
-
110
-
111
-
112
-
113
-
114
-
115
-
116
-
117
-
118
-
119
-
120
-
121
-
122
-
123
-
124
-
125
-
126
-
127
-
128
-
129
-
130
-
131
-
132
-
133
-
134
-
135
-
136
-
137
-
138
-
139
-
140
-
141
-
142
-
143
-
144
-
145
-
146
-
147
-
148
-
149
-
150
-
151
-
152
-
153
-
154
-
155
-
156
-
157
-
158
-
159
-
160
-
161
-
162
-
163
-
164
-
165
-
166
-
167
-
168
-
169
-
170
-
171
-
172
-
173
-
174
-
175
-
176
-
177
-
178
-
179
-
180
-
181
-
182
-
183
-
184
-
185
-
186
-
187
-
188
-
189
-
190
-
191
-
192
-
193
-
194
-
195
-
196
-
197
-
198
-
199
-
200
-
201
-
202
-
203
-
204
-
205
-
206
-
207
-
208
 |
 |

32
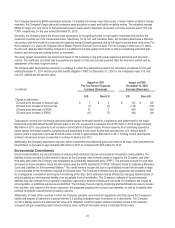
expiration of a significant customer contract in 2009. Cost improvements, primarily within Digital Capture and Devices (+4 pp) and
Consumer Inkjet Systems (+2 pp), positively impacted gross profit margin as a percent of sales and were largely the result of
supplier cost reductions and improved product life cycle management.
The increase in gross profit margin as a percentage of sales from 2008 to 2009 for CDG was primarily attributable to significantly
lower product costs, particularly within Consumer Inkjet Systems (+7 pp) as a result of new product platforms, and Digital Capture
and Devices (+5 pp), resulting from supplier cost reductions and improved product life cycle management. Partially offsetting these
improvements were unfavorable price/mix (-7 pp), largely attributable to the pricing pressures within Digital Capture and Devices as
mentioned above, and unfavorable foreign exchange (-1 pp).
Included in gross profit were non-recurring intellectual property licensing agreements within Digital Capture and Devices. These
licensing agreements contributed $838 million, $435 million and $227 million to gross profit in 2010, 2009 and 2008, respectively.
Selling, General and Administrative Expenses
The increase in SG&A expenses from 2009 to 2010 of 10% for CDG was primarily driven by increased advertising expense.
The decrease in SG&A expenses from 2008 to 2009 of 15% was primarily driven by focused cost reduction actions (-5%)
implemented in 2009 to respond to the current economic conditions.
Research and Development Costs
The increase in R&D costs from 2009 to 2010 of 1% for CDG was not significant.
The decrease in R&D costs from 2008 to 2009 of 29% was primarily attributable to lower spending related to Consumer Inkjet
Systems (-10%), resulting from the movement of product offerings from the development phase into the market introduction and
growth phases, as well as portfolio rationalization within Digital Capture and Devices (-15%).
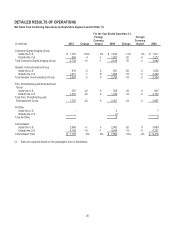
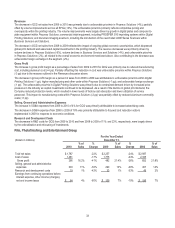
Graphic Communications Group
(dollars in millions)
For the Year Ended
December 31,
2010
% of
Sales
%
Change
2009
% of
Sales
%
Change
2008
% of
Sales
Total net sales
$ 2,681
-2%
$ 2,726
-18%
$ 3,334
Cost of sales
2,012
-3%
2,073
-15%
2,445
Gross profit
669
25.0%
2%
653
24.0%
-27%
889
26.7%
Selling, general and administrative
expenses
543
20%
4%
524
19%
-18%
637
19%
Research and development costs
152
6%
-11%
171
6%
-23%
221
7%
(Loss) earnings from continuing operations
before interest expense, other income
(charges), net and income taxes
$ (26)
-1%
38%
$ (42)
-2%
-235%
$ 31
1%
For the Year Ended
December 31,
Change vs. 2009
2010
Amount
Change
vs. 2009
Volume
Price/Mix
Foreign
Exchange
Manufacturing
and Other Costs
Total net sales
$ 2,681
-1.7%
3.2%
-4.7%
-0.2%
n/a
Gross profit margin
25.0%
1.0pp
n/a
-2.7pp
0.1pp
3.6pp
For the Year Ended
December 31,
Change vs. 2008
2009
Amount
Change
vs. 2008
Volume
Price/Mix
Foreign
Exchange
Manufacturing
and Other Costs
Total net sales
$ 2,726
-18.2%
-14.5%
-1.7%
-2.0%
n/a
Gross profit margin
24.0%
-2.7pp
n/a
-1.1pp
-0.8pp
-0.8pp