Kodak 2010 Annual Report Download - page 89
Download and view the complete annual report
Please find page 89 of the 2010 Kodak annual report below. You can navigate through the pages in the report by either clicking on the pages listed below, or by using the keyword search tool below to find specific information within the annual report.-
 1
1 -
2
-
3
-
4
-
5
-
6
-
7
-
8
-
9
-
10
-
11
-
12
-
13
-
14
-
15
-
16
-
17
-
18
-
19
-
20
-
21
-
22
-
23
-
24
-
25
-
26
-
27
-
28
-
29
-
30
-
31
-
32
-
33
-
34
-
35
-
36
-
37
-
38
-
39
-
40
-
41
-
42
-
43
-
44
-
45
-
46
-
47
-
48
-
49
-
50
-
51
-
52
-
53
-
54
-
55
-
56
-
57
-
58
-
59
-
60
-
61
-
62
-
63
-
64
-
65
-
66
-
67
-
68
-
69
-
70
-
71
-
72
-
73
-
74
-
75
-
76
-
77
-
78
-
 79
79 -
 80
80 -
 81
81 -
 82
82 -
 83
83 -
 84
84 -
 85
85 -
 86
86 -
 87
87 -
 88
88 -
 89
89 -
 90
90 -
 91
91 -
 92
92 -
 93
93 -
 94
94 -
 95
95 -
 96
96 -
 97
97 -
 98
98 -
 99
99 -
100
-
101
-
102
-
103
-
104
-
105
-
106
-
107
-
108
-
109
-
110
-
111
-
112
-
113
-
114
-
115
-
116
-
117
-
118
-
119
-
120
-
121
-
122
-
123
-
124
-
125
-
126
-
127
-
128
-
129
-
130
-
131
-
132
-
133
-
134
-
135
-
136
-
137
-
138
-
139
-
140
-
141
-
142
-
143
-
144
-
145
-
146
-
147
-
148
-
149
-
150
-
151
-
152
-
153
-
154
-
155
-
156
-
157
-
158
-
159
-
160
-
161
-
162
-
163
-
164
-
165
-
166
-
167
-
168
-
169
-
170
-
171
-
172
-
173
-
174
-
175
-
176
-
177
-
178
-
179
-
180
-
181
-
182
-
183
-
184
-
185
-
186
-
187
-
188
-
189
-
190
-
191
-
192
-
193
-
194
-
195
-
196
-
197
-
198
-
199
-
200
-
201
-
202
-
203
-
204
-
205
-
206
-
207
-
208
 |
 |

87
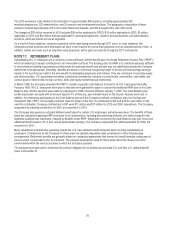
to the notional value of the underlying investment. The remaining cash is available to be deployed and in some cases is invested in a
diversified portfolio of various uncorrelated hedge fund strategies that provide added returns at a lower level of risk. Of the
investments shown in the major U.S. plans table as of December 31, 2010 above, 11% and 15% of the total U.S. assets reported
within equity securities and government bonds, respectively, are reflective of the exposures gained from the use of derivatives, and
are invested in a diversified portfolio of hedge funds using equity, debt, commodity, and currency strategies. Of the investments
shown in the major Non-U.S. plans table as of December 31, 2010 above, 6% and 11% of the total Non-U.S. assets reported within
equity securities and government bonds, respectively, are reflective of the exposures gained from the use of derivatives, and are
invested in a diversified portfolio of hedge funds using equity, debt, commodity, and currency strategies. Foreign currency contracts
and swaps are used to partially hedge foreign currency risk. Additionally, the Company’s major defined benefit pension plans invest
in government bond futures or local government bonds to partially hedge the liability risk of the plans.
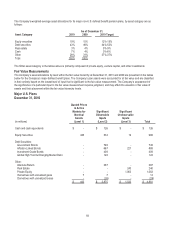
The following is a reconciliation of the beginning and ending balances of level 3 assets of the Company’s major U.S. defined benefit
pension plans:
(in millions)
U.S.
Balance at
January 1, 2010
Net Realized and
Unrealized
Gains/(Losses)
Net Purchases
and Sales
Net Transfer
Into/(Out of)
Level 3
Balance at
December 31, 2010
Equity Securities
$ 7
$ 5
$ 7
$ -
$ 19
Inflation-Linked
Bonds
172
49
-
-
221
Private Equity
958
135
(30)
-
1,063
Real Estate
293
(34)
(19)
-
240
Total
$ 1,430
$ 155
$ (42)
$ -
$ 1,543
(in millions)
U.S.
Balance at
January 1, 2009
Net Realized and
Unrealized
Gains/(Losses)
Net Purchases
and Sales
Net Transfer
Into/(Out of)
Level 3
Balance at
December 31, 2009
Equity Securities
$ 5
$ 2
$ -
$ -
$ 7
Inflations-Linked
Bonds
228
32
(88)
-
172
Private Equity
926
(5)
37
-
958
Real Estate
310
(36)
19
-
293
Total
$ 1,469
$ (7)
$ (32)
$ -
$ 1,430
The following is a reconciliation of the beginning and ending balances of level 3 assets of the Company’s major Non-U.S. defined
benefit pension plans:
(in millions)
Non-U.S.
Balance at
January 1, 2010
Net Realized and
Unrealized
Gains/(Losses)
Net Purchases
and Sales
Net Transfer
Into/(Out of)
Level 3
Balance at
December 31, 2010
Inflation-Linked
Bonds
$ 57
$ 8
$ -
$ -
$ 65
Private Equity
242
32
27
-
301
Real Estate
99
(13)
(9)
-
77
Total
$ 398
$ 27
$ 18
$ -
$ 443