Kodak 2010 Annual Report Download - page 116
Download and view the complete annual report
Please find page 116 of the 2010 Kodak annual report below. You can navigate through the pages in the report by either clicking on the pages listed below, or by using the keyword search tool below to find specific information within the annual report.-
 1
1 -
2
-
3
-
4
-
5
-
6
-
7
-
8
-
9
-
10
-
11
-
12
-
13
-
14
-
15
-
16
-
17
-
18
-
19
-
20
-
21
-
22
-
23
-
24
-
25
-
26
-
27
-
28
-
29
-
30
-
31
-
32
-
33
-
34
-
35
-
36
-
37
-
38
-
39
-
40
-
41
-
42
-
43
-
44
-
45
-
46
-
47
-
48
-
49
-
50
-
51
-
52
-
53
-
54
-
55
-
56
-
57
-
58
-
59
-
60
-
61
-
62
-
63
-
64
-
65
-
66
-
67
-
68
-
69
-
70
-
71
-
72
-
73
-
74
-
75
-
76
-
77
-
78
-
79
-
80
-
81
-
82
-
83
-
84
-
85
-
86
-
87
-
88
-
89
-
90
-
91
-
92
-
93
-
94
-
95
-
96
-
97
-
98
-
99
-
100
-
101
-
102
-
103
-
104
-
105
-
 106
106 -
 107
107 -
 108
108 -
 109
109 -
 110
110 -
 111
111 -
 112
112 -
 113
113 -
 114
114 -
 115
115 -
 116
116 -
 117
117 -
 118
118 -
 119
119 -
 120
120 -
 121
121 -
 122
122 -
 123
123 -
 124
124 -
 125
125 -
 126
126 -
127
-
128
-
129
-
130
-
131
-
132
-
133
-
134
-
135
-
136
-
137
-
138
-
139
-
140
-
141
-
142
-
143
-
144
-
145
-
146
-
147
-
148
-
149
-
150
-
151
-
152
-
153
-
154
-
155
-
156
-
157
-
158
-
159
-
160
-
161
-
162
-
163
-
164
-
165
-
166
-
167
-
168
-
169
-
170
-
171
-
172
-
173
-
174
-
175
-
176
-
177
-
178
-
179
-
180
-
181
-
182
-
183
-
184
-
185
-
186
-
187
-
188
-
189
-
190
-
191
-
192
-
193
-
194
-
195
-
196
-
197
-
198
-
199
-
200
-
201
-
202
-
203
-
204
-
205
-
206
-
207
-
208
 |
 |

114
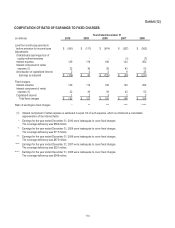
Exhibit (12)
COMPUTATION OF RATIO OF EARNINGS TO FIXED CHARGES
Year Ended December 31
(in millions)
2010
2009
2008
2007
2006
Loss from continuing operations
before provision for income taxes
$ (561)
$ (117)
$ (874)
$ (257)
$ (582)
Adjustments:
Undistributed (earnings) loss of
equity method investees
-
-
-
(1)
(7)
Interest expense
149
119
108
143
262
Interest component of rental
expense (1)
32
36
39
43
53
Amortization of capitalized interest
2
2
2
9
43
Earnings as adjusted
$ (378)
$ 40
$ (725)
$ (63)
$ (231)
Fixed charges:
Interest expense
149
119
108
143
262
Interest component of rental
expense (1)
32
36
39
43
53
Capitalized interest
1
2
3
2
3
Total fixed charges
$ 182
$ 157
$ 150
$ 188
$ 318
Ratio of earnings to fixed charges
*
**
***
****
*****
(1) Interest component of rental expense is estimated to equal 1/3 of such expense, which is considered a reasonable
approximation of the interest factor.
* Earnings for the year ended December 31, 2010 were inadequate to cover fixed charges.
The coverage deficiency was $560 million.
** Earnings for the year ended December 31, 2009 were inadequate to cover fixed charges.
The coverage deficiency was $117 million.
*** Earnings for the year ended December 31, 2008 were inadequate to cover fixed charges.
The coverage deficiency was $875 million.
**** Earnings for the year ended December 31, 2007 were inadequate to cover fixed charges.
The coverage deficiency was $251 million.
***** Earnings for the year ended December 31, 2006 were inadequate to cover fixed charges.
The coverage deficiency was $549 million.