Kodak 2010 Annual Report Download - page 52
Download and view the complete annual report
Please find page 52 of the 2010 Kodak annual report below. You can navigate through the pages in the report by either clicking on the pages listed below, or by using the keyword search tool below to find specific information within the annual report.-
 1
1 -
2
-
3
-
4
-
5
-
6
-
7
-
8
-
9
-
10
-
11
-
12
-
13
-
14
-
15
-
16
-
17
-
18
-
19
-
20
-
21
-
22
-
23
-
24
-
25
-
26
-
27
-
28
-
29
-
30
-
31
-
32
-
33
-
34
-
35
-
36
-
37
-
38
-
39
-
40
-
41
-
 42
42 -
 43
43 -
 44
44 -
 45
45 -
 46
46 -
 47
47 -
 48
48 -
 49
49 -
 50
50 -
 51
51 -
 52
52 -
 53
53 -
 54
54 -
 55
55 -
 56
56 -
 57
57 -
 58
58 -
 59
59 -
 60
60 -
 61
61 -
 62
62 -
63
-
64
-
65
-
66
-
67
-
68
-
69
-
70
-
71
-
72
-
73
-
74
-
75
-
76
-
77
-
78
-
79
-
80
-
81
-
82
-
83
-
84
-
85
-
86
-
87
-
88
-
89
-
90
-
91
-
92
-
93
-
94
-
95
-
96
-
97
-
98
-
99
-
100
-
101
-
102
-
103
-
104
-
105
-
106
-
107
-
108
-
109
-
110
-
111
-
112
-
113
-
114
-
115
-
116
-
117
-
118
-
119
-
120
-
121
-
122
-
123
-
124
-
125
-
126
-
127
-
128
-
129
-
130
-
131
-
132
-
133
-
134
-
135
-
136
-
137
-
138
-
139
-
140
-
141
-
142
-
143
-
144
-
145
-
146
-
147
-
148
-
149
-
150
-
151
-
152
-
153
-
154
-
155
-
156
-
157
-
158
-
159
-
160
-
161
-
162
-
163
-
164
-
165
-
166
-
167
-
168
-
169
-
170
-
171
-
172
-
173
-
174
-
175
-
176
-
177
-
178
-
179
-
180
-
181
-
182
-
183
-
184
-
185
-
186
-
187
-
188
-
189
-
190
-
191
-
192
-
193
-
194
-
195
-
196
-
197
-
198
-
199
-
200
-
201
-
202
-
203
-
204
-
205
-
206
-
207
-
208
 |
 |

50
Eastman Kodak Company
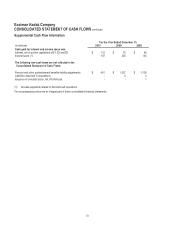
CONSOLIDATED STATEMENT OF CASH FLOWS
For the Year Ended December 31,
(in millions)
2010
2009
2008
Cash flows from operating activities:
Net loss
$ (687)
$ (209)
$ (442)
Adjustments to reconcile to net cash provided by operating activities:
Loss (earnings) from discontinued operations, net of income taxes
12
(17)
(285)
Earnings from extraordinary items, net of income taxes
-
(6)
-
Depreciation and amortization
378
427
500
Gain on sales of businesses/assets
(8)
(100)
(14)
Loss on early extinguishment of debt, net
102
-
-
Non-cash restructuring and rationalization costs, asset
impairments and other charges
635
28
801
(Benefit) provision for deferred income taxes
(91)
(99)
16
Decrease in receivables
118
363
148
(Increase) decrease in inventories
(28)
276
(20)
Decrease in liabilities excluding borrowings
(580)
(821)
(720)
Other items, net
(70)
22
(112)
Total adjustments
468
73
314
Net cash used in continuing operations
(219)
(136)
(128)
Net cash provided by discontinued operations
-
-
296
Net cash (used in) provided by operating activities
(219)
(136)
168
Cash flows from investing activities:
Additions to properties
(149)
(152)
(254)
Proceeds from sales of businesses/assets
32
156
92
Acquisitions, net of cash acquired
-
(17)
(38)
Use (funding) of restricted cash and investment accounts
1
(12)
-
Marketable securities - sales
74
39
162
Marketable securities - purchases
(70)
(36)
(150)
Net cash used in investing activities
(112)
(22)
(188)
Cash flows from financing activities:
Stock repurchases
-
-
(301)
Proceeds from borrowings
503
712
140
Repayment of borrowings
(565)
(649)
(446)
Debt issuance costs
(12)
(30)
-
Dividends to shareholders
-
-
(139)
Net cash (used in) provided by financing activities
(74)
33
(746)
Effect of exchange rate changes on cash
5
4
(36)
Net decrease in cash and cash equivalents
(400)
(121)
(802)
Cash and cash equivalents, beginning of year
2,024
2,145
2,947
Cash and cash equivalents, end of year
$ 1,624
$ 2,024
$ 2,145