Kodak 2010 Annual Report Download - page 71
Download and view the complete annual report
Please find page 71 of the 2010 Kodak annual report below. You can navigate through the pages in the report by either clicking on the pages listed below, or by using the keyword search tool below to find specific information within the annual report.-
 1
1 -
2
-
3
-
4
-
5
-
6
-
7
-
8
-
9
-
10
-
11
-
12
-
13
-
14
-
15
-
16
-
17
-
18
-
19
-
20
-
21
-
22
-
23
-
24
-
25
-
26
-
27
-
28
-
29
-
30
-
31
-
32
-
33
-
34
-
35
-
36
-
37
-
38
-
39
-
40
-
41
-
42
-
43
-
44
-
45
-
46
-
47
-
48
-
49
-
50
-
51
-
52
-
53
-
54
-
55
-
56
-
57
-
58
-
59
-
60
-
 61
61 -
 62
62 -
 63
63 -
 64
64 -
 65
65 -
 66
66 -
 67
67 -
 68
68 -
 69
69 -
 70
70 -
 71
71 -
 72
72 -
 73
73 -
 74
74 -
 75
75 -
 76
76 -
 77
77 -
 78
78 -
 79
79 -
 80
80 -
 81
81 -
82
-
83
-
84
-
85
-
86
-
87
-
88
-
89
-
90
-
91
-
92
-
93
-
94
-
95
-
96
-
97
-
98
-
99
-
100
-
101
-
102
-
103
-
104
-
105
-
106
-
107
-
108
-
109
-
110
-
111
-
112
-
113
-
114
-
115
-
116
-
117
-
118
-
119
-
120
-
121
-
122
-
123
-
124
-
125
-
126
-
127
-
128
-
129
-
130
-
131
-
132
-
133
-
134
-
135
-
136
-
137
-
138
-
139
-
140
-
141
-
142
-
143
-
144
-
145
-
146
-
147
-
148
-
149
-
150
-
151
-
152
-
153
-
154
-
155
-
156
-
157
-
158
-
159
-
160
-
161
-
162
-
163
-
164
-
165
-
166
-
167
-
168
-
169
-
170
-
171
-
172
-
173
-
174
-
175
-
176
-
177
-
178
-
179
-
180
-
181
-
182
-
183
-
184
-
185
-
186
-
187
-
188
-
189
-
190
-
191
-
192
-
193
-
194
-
195
-
196
-
197
-
198
-
199
-
200
-
201
-
202
-
203
-
204
-
205
-
206
-
207
-
208
 |
 |

69
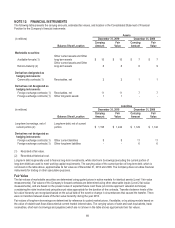
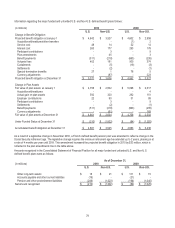
NOTE 12: FINANCIAL INSTRUMENTS
The following table presents the carrying amounts, estimated fair values, and location in the Consolidated Statement of Financial
Position for the Company’s financial instruments:
Assets
(in millions)
December 31, 2010
December 31, 2009
Balance Sheet Location
Carrying
Amount
Fair
Value
Carrying
Amount
Fair
Value
Marketable securities:
Available-for-sale (1)
Other current assets and Other
long-term assets
$ 10
$ 10
$ 7
$ 7
Held-to-maturity (2)
Other current assets and Other
long-term assets
8
8
8
9
Derivatives designated as
hedging instruments:
Commodity contracts (1)
Receivables, net
2
2
1
1
Derivatives not designated as
hedging instruments:
Foreign exchange contracts (1)
Receivables, net
11
11
7
7
Foreign exchange contracts (1)
Other long-term assets
1
1
-
-
Liabilities
(in millions)
December 31, 2010
December 31, 2009
Balance Sheet Location
Carrying
Amount
Fair
Value
Carrying
Amount
Fair
Value
Long-term borrowings, net of
current portion (2)
Long-term debt, net of current
portion
$ 1,195
$ 1,242
$ 1,129
$ 1,142
Derivatives not designated as
hedging instruments:
Foreign exchange contracts (1)
Other current liabilities
8
8
11
11
Foreign exchange contracts (1)
Other long-term liabilities
-
-
6
6
(1) Recorded at fair value.
(2) Recorded at historical cost.
Long-term debt is generally used to finance long-term investments, while short-term borrowings (excluding the current portion of
long-term debt) are used to meet working capital requirements. The carrying value of the current portion of long-term debt, which is
not shown in the table above, approximates its fair value as of December 31, 2010 and 2009. The Company does not utilize financial
instruments for trading or other speculative purposes.
Fair Value
The fair values of marketable securities are determined using quoted prices in active markets for identical assets (Level 1 fair value
measurements). Fair values of the Company’s forward contracts are determined using other observable inputs (Level 2 fair value
measurements), and are based on the present value of expected future cash flows (an income approach valuation technique)
considering the risks involved and using discount rates appropriate for the duration of the contracts. Transfers between levels of the
fair value hierarchy are recognized based on the actual date of the event or change in circumstances that caused the transfer. There
were no transfers between levels of the fair value hierarchy during the year 2010.
Fair values of long-term borrowings are determined by reference to quoted market prices, if available, or by pricing models based on
the value of related cash flows discounted at current market interest rates. The carrying values of cash and cash equivalents, trade
receivables, short-term borrowings and payables (which are not shown in the table above) approximate their fair values.