Kodak 2010 Annual Report Download - page 86
Download and view the complete annual report
Please find page 86 of the 2010 Kodak annual report below. You can navigate through the pages in the report by either clicking on the pages listed below, or by using the keyword search tool below to find specific information within the annual report.-
 1
1 -
2
-
3
-
4
-
5
-
6
-
7
-
8
-
9
-
10
-
11
-
12
-
13
-
14
-
15
-
16
-
17
-
18
-
19
-
20
-
21
-
22
-
23
-
24
-
25
-
26
-
27
-
28
-
29
-
30
-
31
-
32
-
33
-
34
-
35
-
36
-
37
-
38
-
39
-
40
-
41
-
42
-
43
-
44
-
45
-
46
-
47
-
48
-
49
-
50
-
51
-
52
-
53
-
54
-
55
-
56
-
57
-
58
-
59
-
60
-
61
-
62
-
63
-
64
-
65
-
66
-
67
-
68
-
69
-
70
-
71
-
72
-
73
-
74
-
75
-
 76
76 -
 77
77 -
 78
78 -
 79
79 -
 80
80 -
 81
81 -
 82
82 -
 83
83 -
 84
84 -
 85
85 -
 86
86 -
 87
87 -
 88
88 -
 89
89 -
 90
90 -
 91
91 -
 92
92 -
 93
93 -
 94
94 -
 95
95 -
 96
96 -
97
-
98
-
99
-
100
-
101
-
102
-
103
-
104
-
105
-
106
-
107
-
108
-
109
-
110
-
111
-
112
-
113
-
114
-
115
-
116
-
117
-
118
-
119
-
120
-
121
-
122
-
123
-
124
-
125
-
126
-
127
-
128
-
129
-
130
-
131
-
132
-
133
-
134
-
135
-
136
-
137
-
138
-
139
-
140
-
141
-
142
-
143
-
144
-
145
-
146
-
147
-
148
-
149
-
150
-
151
-
152
-
153
-
154
-
155
-
156
-
157
-
158
-
159
-
160
-
161
-
162
-
163
-
164
-
165
-
166
-
167
-
168
-
169
-
170
-
171
-
172
-
173
-
174
-
175
-
176
-
177
-
178
-
179
-
180
-
181
-
182
-
183
-
184
-
185
-
186
-
187
-
188
-
189
-
190
-
191
-
192
-
193
-
194
-
195
-
196
-
197
-
198
-
199
-
200
-
201
-
202
-
203
-
204
-
205
-
206
-
207
-
208
 |
 |

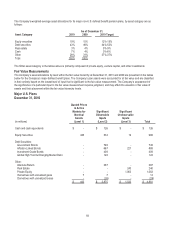
84
Major U.S. Plans
December 31, 2009
(in millions)
Quoted Prices
in Active
Markets for
Identical
Assets
(Level 1)
Significant
Observable
Inputs
(Level 2)
Significant
Unobservable
Inputs
(Level 3)
Total
Cash and cash equivalents
$ -
$ 82
$ -
$ 82
Equity Securities
260
732
7
999
Debt Securities:
Government Bonds
-
799
-
799
Inflation-Linked Bonds
-
648
172
820
Investment Grade Bonds
-
370
-
370
Global High Yield & Emerging Market Debt
-
144
-
144
Other:
Absolute Return
-
328
-
328
Real Estate
-
-
293
293
Private Equity
-
-
958
958
Insurance Contracts
-
2
-
2
Derivatives with unrealized gains
-
2
-
2
Derivatives with unrealized losses
(1)
(38)
-
(39)
$ 259
$ 3,069
$ 1,430
$ 4,758
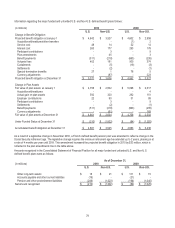
For the Company’s major U.S. defined benefit pension plans, equity investments are invested broadly in U.S. equity, developed
international equity, and emerging markets. Fixed income investments are comprised primarily of long duration U.S. Treasuries and
global government bonds, as well as U.S. and emerging market companies’ debt securities diversified by sector, geography, and
through a wide range of market capitalizations. Real estate investments include investments in office, industrial, retail and apartment
properties. Other investments include private equity, hedge funds and natural resource investments. Private equity investments are
primarily comprised of limited partnerships and fund-of-fund investments that invest in distressed investments, venture capital,
leveraged buyout and special situation funds. Natural resource investments in oil and gas partnerships and timber funds are also
included in this category. Absolute return investments are comprised of hedge funds that use equity long-short strategies.