Kodak 2010 Annual Report Download - page 88
Download and view the complete annual report
Please find page 88 of the 2010 Kodak annual report below. You can navigate through the pages in the report by either clicking on the pages listed below, or by using the keyword search tool below to find specific information within the annual report.-
 1
1 -
2
-
3
-
4
-
5
-
6
-
7
-
8
-
9
-
10
-
11
-
12
-
13
-
14
-
15
-
16
-
17
-
18
-
19
-
20
-
21
-
22
-
23
-
24
-
25
-
26
-
27
-
28
-
29
-
30
-
31
-
32
-
33
-
34
-
35
-
36
-
37
-
38
-
39
-
40
-
41
-
42
-
43
-
44
-
45
-
46
-
47
-
48
-
49
-
50
-
51
-
52
-
53
-
54
-
55
-
56
-
57
-
58
-
59
-
60
-
61
-
62
-
63
-
64
-
65
-
66
-
67
-
68
-
69
-
70
-
71
-
72
-
73
-
74
-
75
-
76
-
77
-
 78
78 -
 79
79 -
 80
80 -
 81
81 -
 82
82 -
 83
83 -
 84
84 -
 85
85 -
 86
86 -
 87
87 -
 88
88 -
 89
89 -
 90
90 -
 91
91 -
 92
92 -
 93
93 -
 94
94 -
 95
95 -
 96
96 -
 97
97 -
 98
98 -
99
-
100
-
101
-
102
-
103
-
104
-
105
-
106
-
107
-
108
-
109
-
110
-
111
-
112
-
113
-
114
-
115
-
116
-
117
-
118
-
119
-
120
-
121
-
122
-
123
-
124
-
125
-
126
-
127
-
128
-
129
-
130
-
131
-
132
-
133
-
134
-
135
-
136
-
137
-
138
-
139
-
140
-
141
-
142
-
143
-
144
-
145
-
146
-
147
-
148
-
149
-
150
-
151
-
152
-
153
-
154
-
155
-
156
-
157
-
158
-
159
-
160
-
161
-
162
-
163
-
164
-
165
-
166
-
167
-
168
-
169
-
170
-
171
-
172
-
173
-
174
-
175
-
176
-
177
-
178
-
179
-
180
-
181
-
182
-
183
-
184
-
185
-
186
-
187
-
188
-
189
-
190
-
191
-
192
-
193
-
194
-
195
-
196
-
197
-
198
-
199
-
200
-
201
-
202
-
203
-
204
-
205
-
206
-
207
-
208
 |
 |

86
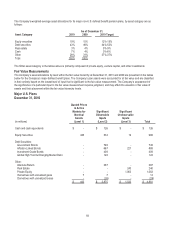
Major Non-U.S. Plans
December 31, 2009
(in millions)
Quoted Prices
in Active
Markets for
Identical
Assets
(Level 1)
Significant
Observable
Inputs
(Level 2)
Significant
Unobservable
Inputs
(Level 3)
Total
Cash and cash equivalents
$ -
$ 98
$ -
$ 98
Equity securities
71
312
-
383
Debt securities:
Government Bonds
-
526
-
526
Inflation-Linked Bonds
-
290
57
347
Investment Grade Bonds
-
107
-
107
Global High Yield & Emerging Market Debt
-
180
-
180
Other:
Absolute Return
-
78
-
78
Real Estate
-
4
99
103
Private Equity
-
2
242
244
Insurance Contracts
-
448
-
448
Derivatives with unrealized gains
-
3
-
3
Derivatives with unrealized losses
-
(15)
-
(15)
$ 71
$ 2,033
$ 398
$ 2,502
For the Company’s major non-U.S. defined benefit pension plans, equity investments are invested broadly in local equity, developed
international and emerging markets. Fixed income investments are comprised primarily of long duration government and corporate
bonds with some emerging market debt. Real estate investments include investments in primarily office, industrial, and retail
properties. Other investments include private equity, hedge funds, and insurance contracts. Private equity investments are
comprised of limited partnerships and fund-of-fund investments that invest in distressed investments, venture capital and leveraged
buyout funds. Absolute return investments are comprised of hedge funds that use equity long-short strategies.
Cash and cash equivalents are valued utilizing cost approach valuation techniques. Equity securities and debt securities are valued
using a market approach based on the closing price on the last business day of the year (if the securities are traded on an active
market), or based on the proportionate share of the estimated fair value of the underlying assets (net asset value). Other
investments are valued using a combination of market, income, and cost approaches, based on the nature of the investment.
Absolute return investments are primarily valued based on net asset value derived from observable market inputs. Real estate
investments are valued primarily based on independent appraisals and discounted cash flow models, taking into consideration
discount rates and local market conditions. Private equity investments are valued primarily based on independent appraisals,
discounted cash flow models, cost, and comparable market transactions, which include inputs such as discount rates and pricing
data from the most recent equity financing. Insurance contracts are primarily valued based on contract values, which approximate
fair value.
Some of the plans’ assets, primarily absolute return, real estate, and private equity, do not have readily determinable market values
due to the nature of these investments. For these investments, fund manager or general partner estimates were used where
available. The estimates for the absolute return assets are derived from observable inputs, based on the fair value of the underlying
positions, which have readily available market prices. For investments with lagged pricing, the Company used the available net asset
values, and also considered expected return, subsequent cash flows and material events.
For all of the Company’s major defined benefit pension plans, investment managers are selected that are expected to provide best-
in-class asset management for their particular asset class, and expected returns greater than those expected from existing salable
assets, especially if this would maintain the aggregate volatility desired for each plan’s portfolio. Investment managers are retained
for the purpose of managing specific investment strategies within contractual investment guidelines. Certain investment managers
are authorized to invest in derivatives such as futures, swaps, and currency forward contracts. Investments in futures and swaps are
used to obtain targeted exposure to a particular asset, index or bond duration and only require a portion of the cash to gain exposure