Kodak 2010 Annual Report Download - page 30
Download and view the complete annual report
Please find page 30 of the 2010 Kodak annual report below. You can navigate through the pages in the report by either clicking on the pages listed below, or by using the keyword search tool below to find specific information within the annual report.-
 1
1 -
2
-
3
-
4
-
5
-
6
-
7
-
8
-
9
-
10
-
11
-
12
-
13
-
14
-
15
-
16
-
17
-
18
-
19
-
 20
20 -
 21
21 -
 22
22 -
 23
23 -
 24
24 -
 25
25 -
 26
26 -
 27
27 -
 28
28 -
 29
29 -
 30
30 -
 31
31 -
 32
32 -
 33
33 -
 34
34 -
 35
35 -
 36
36 -
 37
37 -
 38
38 -
 39
39 -
 40
40 -
41
-
42
-
43
-
44
-
45
-
46
-
47
-
48
-
49
-
50
-
51
-
52
-
53
-
54
-
55
-
56
-
57
-
58
-
59
-
60
-
61
-
62
-
63
-
64
-
65
-
66
-
67
-
68
-
69
-
70
-
71
-
72
-
73
-
74
-
75
-
76
-
77
-
78
-
79
-
80
-
81
-
82
-
83
-
84
-
85
-
86
-
87
-
88
-
89
-
90
-
91
-
92
-
93
-
94
-
95
-
96
-
97
-
98
-
99
-
100
-
101
-
102
-
103
-
104
-
105
-
106
-
107
-
108
-
109
-
110
-
111
-
112
-
113
-
114
-
115
-
116
-
117
-
118
-
119
-
120
-
121
-
122
-
123
-
124
-
125
-
126
-
127
-
128
-
129
-
130
-
131
-
132
-
133
-
134
-
135
-
136
-
137
-
138
-
139
-
140
-
141
-
142
-
143
-
144
-
145
-
146
-
147
-
148
-
149
-
150
-
151
-
152
-
153
-
154
-
155
-
156
-
157
-
158
-
159
-
160
-
161
-
162
-
163
-
164
-
165
-
166
-
167
-
168
-
169
-
170
-
171
-
172
-
173
-
174
-
175
-
176
-
177
-
178
-
179
-
180
-
181
-
182
-
183
-
184
-
185
-
186
-
187
-
188
-
189
-
190
-
191
-
192
-
193
-
194
-
195
-
196
-
197
-
198
-
199
-
200
-
201
-
202
-
203
-
204
-
205
-
206
-
207
-
208
 |
 |

28
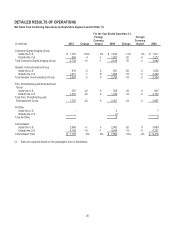
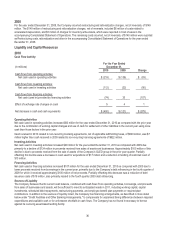
Results of Operations – Continuing Operations
Consolidated
For the Year Ended
December 31,
(dollars in millions)
2010
% of
Sales
%
Change
2009
% of
Sales
%
Change
2008
% of
Sales
Net sales
$ 7,187
-6%
$ 7,606
-19%
$ 9,416
Cost of sales
5,236
-10%
5,838
-19%
7,247
Gross profit
1,951
27.1%
10%
1,768
23.2%
-18%
2,169
23.0%
Selling, general and administrative
expenses
1,277
18%
-2%
1,302
17%
-19%
1,606
17%
Research and development costs
321
4%
-10%
356
5%
-26%
478
5%
Restructuring costs, rationalization and
other
70
-69%
226
61%
140
Other operating expenses (income), net
619
803%
(88)
111%
766
Loss from continuing operations before
interest expense, other income (charges),
net and income taxes
(336)
-5%
(28)
0%
(821)
-9%
Interest expense
149
25%
119
10%
108
Loss on early extinguishment of debt, net
102
-
-
Other income (charges), net
26
-13%
30
-45%
55
Loss from continuing operations before
income taxes
(561)
-379%
(117)
87%
(874)
Provision (benefit) for income taxes
114
-1%
115
178%
(147)
Loss from continuing operations
(675)
-9%
-191%
(232)
-3%
68%
(727)
-8%
(Loss) earnings from discontinued
operations, net of income taxes
(12)
17
285
Extraordinary item, net of tax
-
6
-
NET LOSS
(687)
(209)
(442)
Less: Net earnings attributable to
noncontrolling interests
-
(1)
-
NET LOSS ATTRIBUTABLE TO
EASTMAN KODAK COMPANY
$ (687)
-227%
$ (210)
52%
$ (442)
For the Year Ended
December 31,
Change vs. 2009
2010
Amount
Change
vs. 2009
Volume
Price/Mix
Foreign
Exchange
Manufacturing and
Other Costs
Total net sales
$ 7,187
-5.5%
-5.2%
0.0%
-0.3%
n/a
Gross profit margin
27.1%
3.9pp
n/a
1.0pp
0.1pp
2.8pp
For the Year Ended
December 31,
Change vs. 2008
2009
Amount
Change
vs. 2008
Volume
Price/Mix
Foreign
Exchange
Manufacturing and
Other Costs
Total net sales
$ 7,606
-19.2%
-14.5%
-2.5%
-2.2%
n/a
Gross profit margin
23.2%
0.2pp
n/a
-3.6pp
-1.3pp
5.1pp