Chrysler 2004 Annual Report Download - page 93
Download and view the complete annual report
Please find page 93 of the 2004 Chrysler annual report below. You can navigate through the pages in the report by either clicking on the pages listed below, or by using the keyword search tool below to find specific information within the annual report.-
 1
1 -
2
-
3
-
4
-
5
-
6
-
7
-
8
-
9
-
10
-
11
-
12
-
13
-
14
-
15
-
16
-
17
-
18
-
19
-
20
-
21
-
22
-
23
-
24
-
25
-
26
-
27
-
28
-
29
-
30
-
31
-
32
-
33
-
34
-
35
-
36
-
37
-
38
-
39
-
40
-
41
-
42
-
43
-
44
-
45
-
46
-
47
-
48
-
49
-
50
-
51
-
52
-
53
-
54
-
55
-
56
-
57
-
58
-
59
-
60
-
61
-
62
-
63
-
64
-
65
-
66
-
67
-
68
-
69
-
70
-
71
-
72
-
73
-
74
-
75
-
76
-
77
-
78
-
79
-
80
-
81
-
82
-
 83
83 -
 84
84 -
 85
85 -
 86
86 -
 87
87 -
 88
88 -
 89
89 -
 90
90 -
 91
91 -
 92
92 -
 93
93 -
 94
94 -
 95
95 -
 96
96 -
 97
97 -
 98
98 -
 99
99 -
 100
100 -
 101
101 -
 102
102 -
 103
103 -
104
-
105
-
106
-
107
-
108
-
109
-
110
-
111
-
112
-
113
-
114
-
115
-
116
-
117
-
118
-
119
-
120
-
121
-
122
-
123
-
124
-
125
-
126
-
127
-
128
-
129
-
130
-
131
-
132
-
133
-
134
-
135
-
136
-
137
-
138
-
139
-
140
-
141
-
142
-
143
-
144
-
145
-
146
-
147
-
148
-
149
-
150
-
151
-
152
-
153
-
154
-
155
-
156
-
157
-
158
-
159
-
160
-
161
-
162
-
163
-
164
-
165
-
166
-
167
-
168
-
169
-
170
-
171
-
172
-
173
-
174
-
175
-
176
-
177
-
178
-
179
-
180
-
181
-
182
-
183
-
184
-
185
-
186
-
187
-
188
-
189
-
190
-
191
-
192
-
193
-
194
-
195
-
196
-
197
-
198
-
199
-
200
-
201
-
202
-
203
-
204
-
205
-
206
-
207
-
208
-
209
-
210
-
211
-
212
-
213
-
214
-
215
-
216
-
217
-
218
-
219
-
220
-
221
-
222
-
223
-
224
-
225
-
226
-
227
 |
 |

91
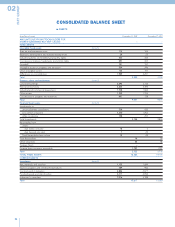
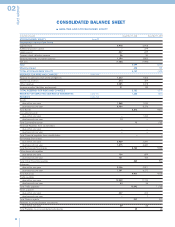
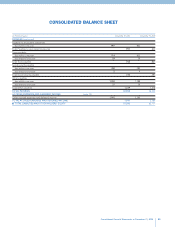
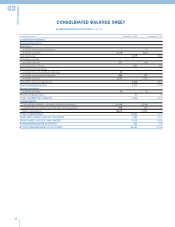
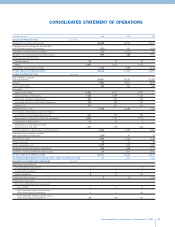
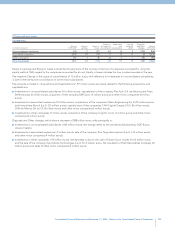
Consolidated Financial Statements at December 31, 2004
CONSOLIDATED STATEMENT OF OPERATIONS
(in millions of euros) 2004 2003 2002
VALUE OF PRODUCTION (note 15)
Revenues from sales and services 46,488 48,346 55,427
Change in work in progress, semifinished
and finished products inventories (202) 700 (816)
Change in contract work in progress 215 (1,075) 222
Additions to internally produced fixed assets 809 688 1,107
Other income and revenues:
revenue grants 54 52 47
other 1,462 1,637 2,105
Total Other income and revenues 1,516 1,689 2,152
TOTAL VALUE OF PRODUCTION 48,826 50,348 58,092
COSTS OF PRODUCTION (note 16)
Raw materials, supplies
and merchandise 28,951 28,392 30,289
Services 7,984 8,505 9,890
Leases and rentals 364 367 468
Personnel:
salaries and wages 4,462 4,707 5,457
social security contributions 1,168 1,249 1,365
employee severance indemnities 187 244 256
employee pensions and similar obligations 178 185 100
other costs 374 303 376
Total Personnel costs 6,369 6,688 7,554
Amortization, depreciation and writedowns:
amortization of intangible fixed assets 475 519 595
depreciation of property, plant and equipment 1,693 1,750 2,019
writedown of fixed assets 31 35 3
writedown of receivables among
current assets and cash 287 278 366
Total Amortization, depreciation and writedowns 2,486 2,582 2,983
Change in raw materials, supplies
and merchandise inventories (230)8138
Provisions for risks 1,394 1,163 1,138
Other provisions 15 17 30
Other operating costs 1,075 1,028 1,304
Expenses of financial services companies 376 668 1,115
Insurance claims and other insurance costs 20 1,367 4,045
TOTAL COSTS OF PRODUCTION 48,804 50,858 58,854
DIFFERENCE BETWEEN THE VALUE AND COSTS OF PRODUCTION 22 (510) (762)
FINANCIAL INCOME AND EXPENSES (note 17)
Investment income from:
unconsolidated subsidiaries ––4
associated companies 111
other companies 821 151
Total Investment income 922 156
Other financial income:
from receivables held as fixed assets:
from others –32
from securities held as fixed assets
other than equity investments 1– 156
from securities held as current assets
other than equity investments 39 119 147