Chrysler 2004 Annual Report Download - page 102
Download and view the complete annual report
Please find page 102 of the 2004 Chrysler annual report below. You can navigate through the pages in the report by either clicking on the pages listed below, or by using the keyword search tool below to find specific information within the annual report.-
 1
1 -
2
-
3
-
4
-
5
-
6
-
7
-
8
-
9
-
10
-
11
-
12
-
13
-
14
-
15
-
16
-
17
-
18
-
19
-
20
-
21
-
22
-
23
-
24
-
25
-
26
-
27
-
28
-
29
-
30
-
31
-
32
-
33
-
34
-
35
-
36
-
37
-
38
-
39
-
40
-
41
-
42
-
43
-
44
-
45
-
46
-
47
-
48
-
49
-
50
-
51
-
52
-
53
-
54
-
55
-
56
-
57
-
58
-
59
-
60
-
61
-
62
-
63
-
64
-
65
-
66
-
67
-
68
-
69
-
70
-
71
-
72
-
73
-
74
-
75
-
76
-
77
-
78
-
79
-
80
-
81
-
82
-
83
-
84
-
85
-
86
-
87
-
88
-
89
-
90
-
91
-
 92
92 -
 93
93 -
 94
94 -
 95
95 -
 96
96 -
 97
97 -
 98
98 -
 99
99 -
 100
100 -
 101
101 -
 102
102 -
 103
103 -
 104
104 -
 105
105 -
 106
106 -
 107
107 -
 108
108 -
 109
109 -
 110
110 -
 111
111 -
 112
112 -
113
-
114
-
115
-
116
-
117
-
118
-
119
-
120
-
121
-
122
-
123
-
124
-
125
-
126
-
127
-
128
-
129
-
130
-
131
-
132
-
133
-
134
-
135
-
136
-
137
-
138
-
139
-
140
-
141
-
142
-
143
-
144
-
145
-
146
-
147
-
148
-
149
-
150
-
151
-
152
-
153
-
154
-
155
-
156
-
157
-
158
-
159
-
160
-
161
-
162
-
163
-
164
-
165
-
166
-
167
-
168
-
169
-
170
-
171
-
172
-
173
-
174
-
175
-
176
-
177
-
178
-
179
-
180
-
181
-
182
-
183
-
184
-
185
-
186
-
187
-
188
-
189
-
190
-
191
-
192
-
193
-
194
-
195
-
196
-
197
-
198
-
199
-
200
-
201
-
202
-
203
-
204
-
205
-
206
-
207
-
208
-
209
-
210
-
211
-
212
-
213
-
214
-
215
-
216
-
217
-
218
-
219
-
220
-
221
-
222
-
223
-
224
-
225
-
226
-
227
 |
 |
FIAT GROUP
02
100
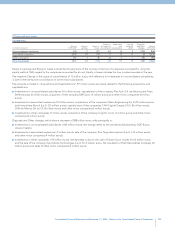
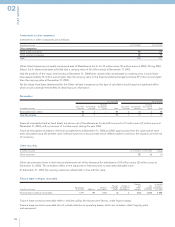
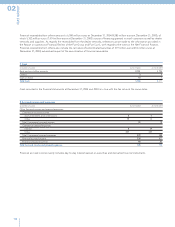
2 Property, plant and equipment
Net of Change in Foreign Disposals Net of
Accumulated
depreciation the scope of Reclassi- exchange and Other depreciation depreciation
(in millions of euros) 12/31/2003 Additions
Depreciation
consolidation fications effects changes 12/31/2004 12/31/2004
Land and buildings 2,736 61 (139) 16 56 29 (63) 2,696 2,010
Plant and machinery 3,393 293 (605) 28 167 4 (76) 3,204 7,810
Industrial and commercial equipment 1,504 493 (627) 14 323 16 (15) 1,708 6,828
Other assets 1,314 616 (322) (1) 11 (11) (375) 1,232 1,716
Construction in progress and advances 728 649 – 3 (557) (1) (125) 697 –
Total Property, plant and equipment 9,675 2,112 (1,693) 60 – 37 (654) 9,537 18,364
Property, plant and equipment include revaluations required or allowed by national laws, which, net of related accumulated
depreciation, amount to 197 million euros at December 31, 2004 (231 million euros at December 31, 2003).
No interest expenses were capitalized in 2004 or in 2003.
The change in the scope of consolidation shows a positive balance of 60 million euros as a result of the inclusion of companies
in consolidation for 125 million euros and the sale of companies for 65 million euros.
Reclassifications refer to a reduction in construction in progress and advances on purchases of property, plant and equipment
existing at the end of the prior year which were reclassified at the time they were effectively acquired and put into operation.
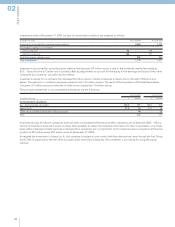
Disposals and Other changes, with a negative balance of 654 million euros, also includes the writedowns recorded during the year
for 84 million euros (351 million euros in 2003), detailed by Sector as follows: Automobiles 75 million euros, Metallurgical Products 4
million euros, Components 1 million euros, and other minor companies 4 million euros. This item also comprises disposals relating
to assets on operating leases of 303 million euros.
Other assets include vehicles on operating leases for 828 million euros at December 31, 2004 (914 million euros at December 31,
2003), mainly relating to long-term leases.
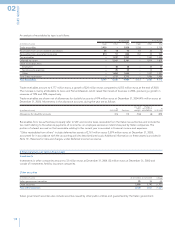
The depreciation rates used are determined on the basis of the estimated useful lives of the assets and are listed below:
Depreciation rates
Land and buildings 3% – 9%
Plant and machinery 8% – 21%
Industrial and commercial equipment 16% – 28%
Other assets 11% – 25%