Chrysler 2004 Annual Report Download - page 79
Download and view the complete annual report
Please find page 79 of the 2004 Chrysler annual report below. You can navigate through the pages in the report by either clicking on the pages listed below, or by using the keyword search tool below to find specific information within the annual report.-
 1
1 -
2
-
3
-
4
-
5
-
6
-
7
-
8
-
9
-
10
-
11
-
12
-
13
-
14
-
15
-
16
-
17
-
18
-
19
-
20
-
21
-
22
-
23
-
24
-
25
-
26
-
27
-
28
-
29
-
30
-
31
-
32
-
33
-
34
-
35
-
36
-
37
-
38
-
39
-
40
-
41
-
42
-
43
-
44
-
45
-
46
-
47
-
48
-
49
-
50
-
51
-
52
-
53
-
54
-
55
-
56
-
57
-
58
-
59
-
60
-
61
-
62
-
63
-
64
-
65
-
66
-
67
-
68
-
 69
69 -
 70
70 -
 71
71 -
 72
72 -
 73
73 -
 74
74 -
 75
75 -
 76
76 -
 77
77 -
 78
78 -
 79
79 -
 80
80 -
 81
81 -
 82
82 -
 83
83 -
 84
84 -
 85
85 -
 86
86 -
 87
87 -
 88
88 -
 89
89 -
90
-
91
-
92
-
93
-
94
-
95
-
96
-
97
-
98
-
99
-
100
-
101
-
102
-
103
-
104
-
105
-
106
-
107
-
108
-
109
-
110
-
111
-
112
-
113
-
114
-
115
-
116
-
117
-
118
-
119
-
120
-
121
-
122
-
123
-
124
-
125
-
126
-
127
-
128
-
129
-
130
-
131
-
132
-
133
-
134
-
135
-
136
-
137
-
138
-
139
-
140
-
141
-
142
-
143
-
144
-
145
-
146
-
147
-
148
-
149
-
150
-
151
-
152
-
153
-
154
-
155
-
156
-
157
-
158
-
159
-
160
-
161
-
162
-
163
-
164
-
165
-
166
-
167
-
168
-
169
-
170
-
171
-
172
-
173
-
174
-
175
-
176
-
177
-
178
-
179
-
180
-
181
-
182
-
183
-
184
-
185
-
186
-
187
-
188
-
189
-
190
-
191
-
192
-
193
-
194
-
195
-
196
-
197
-
198
-
199
-
200
-
201
-
202
-
203
-
204
-
205
-
206
-
207
-
208
-
209
-
210
-
211
-
212
-
213
-
214
-
215
-
216
-
217
-
218
-
219
-
220
-
221
-
222
-
223
-
224
-
225
-
226
-
227
 |
 |
77
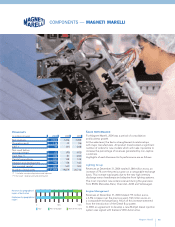
Comau
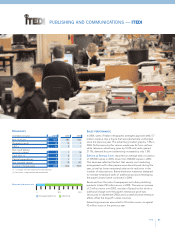
SALES PERFORMANCE
In 2004, the Sector’s reference market continued to be adversely
affected by a climate of uncertainty and by the financial
difficulties experienced by most automotive manufacturers, both
of which impacted capital investment policies. The euro’s sharp
rise against the dollar also gave Japanese and Korean suppliers
an advantage over their European counterparts in the emerging
markets and the US.
In 2004, new orders for contract work came to 1,463 million
euros, an increase of 5% over 2003, or 10% on a comparable
consolidation and exchange rate basis. Strong growth in the
volume of orders from the NAFTA area (up 50% on a
comparable exchange basis) compensated for the unfavorable
effect of the depreciation of the dollar against the euro.
Overall, 55% of the orders for contract work were acquired in
Europe and 32% in the NAFTA area, with the remaining 13%
coming from the Mercosur and new markets (4% from China).
Orders can be broken down as follows: 20% from Fiat Group
companies (as against 19% in 2003), and 80% from other
automotive manufacturers.
At December 31, 2004, the order portfolio for contract work
amounted to 1,042 million euros on a comparable consolidation
basis, an increase of around 7% over the previous year.
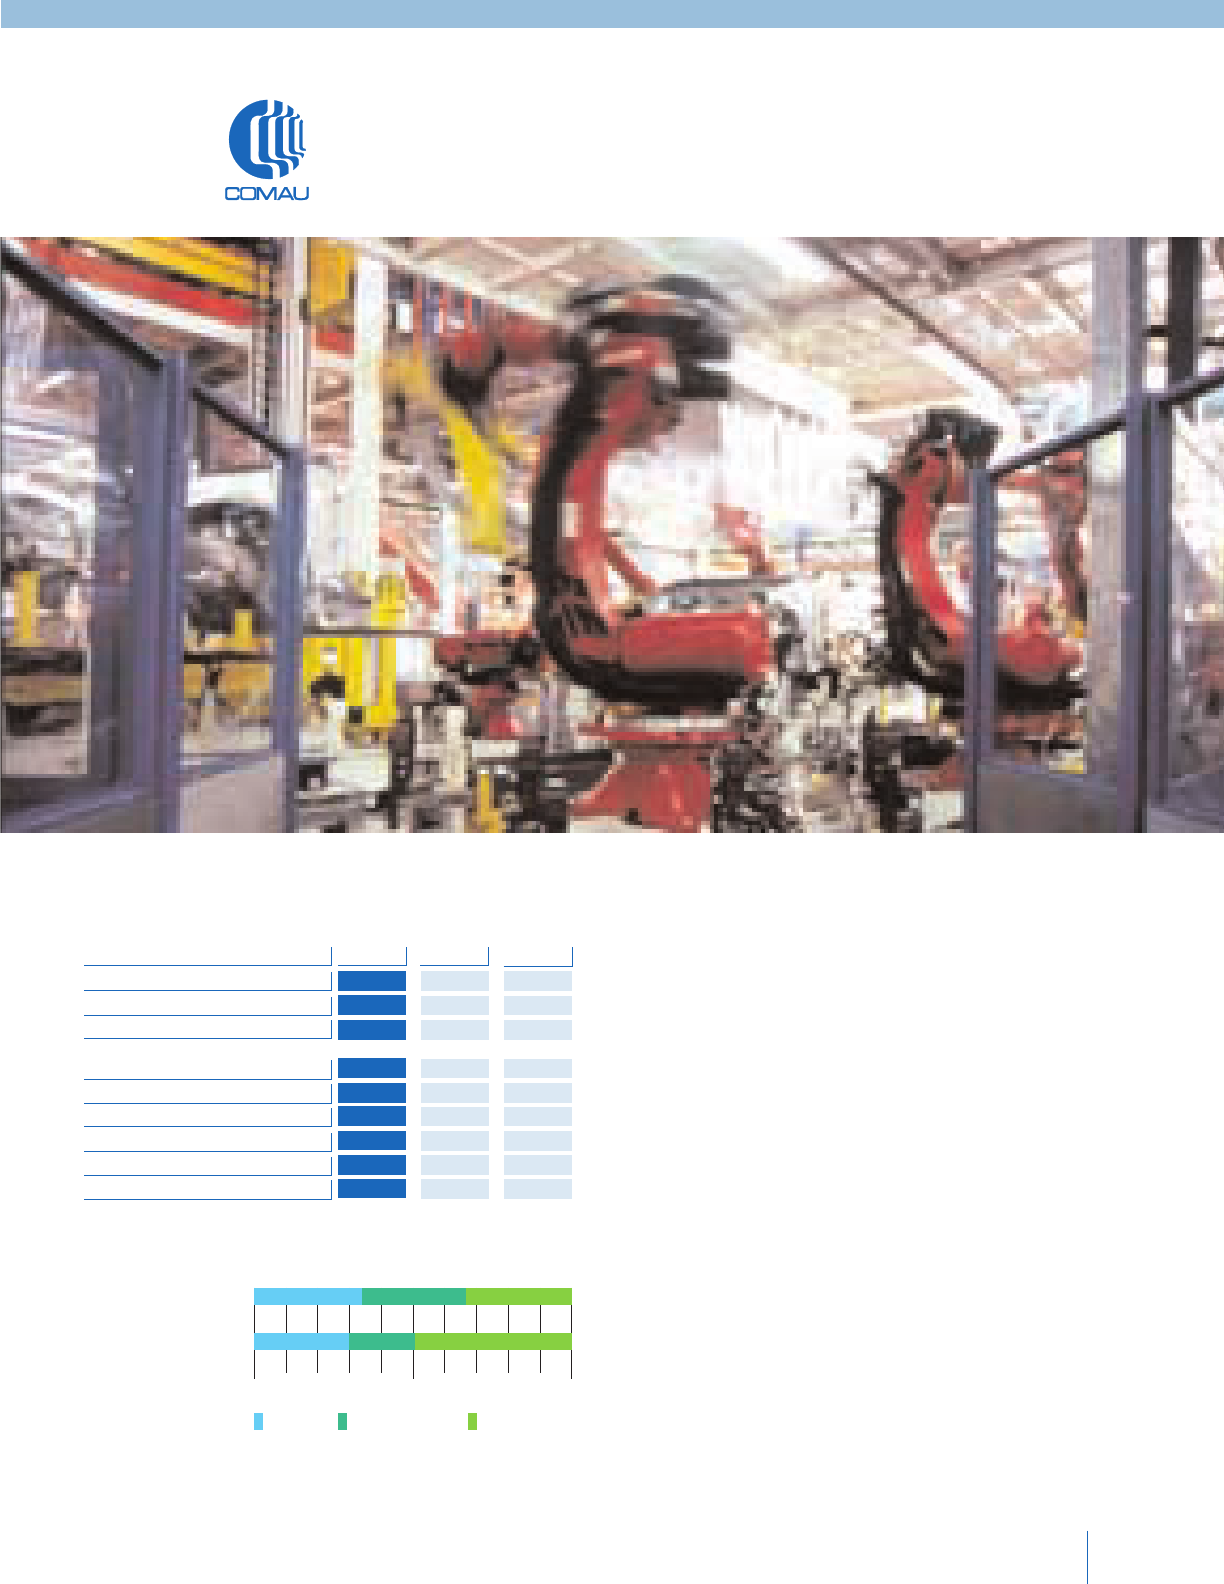
PRODUCTION SYSTEMS — COMAU
Italy Rest of Europe Rest of the world
Revenues by geographical
region of destination
Employees by geographical
region
0 50% 100%
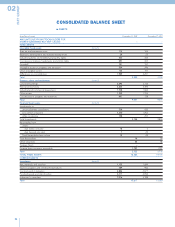
HIGHLIGHTS
(in millions of euros) 2004 2003 2002
Net revenues 1,716 2,293 2,320
Operating result 32 2 (101)
EBIT (*) 15 (122) (247)
Net result before
minority interest (15) (164) (302)
Cash flow (**) 28 (108) (238)
Capital expenditures 14 18 20
Research and development 17 17 17
Net invested capital 191 205 163
Number of employees 13,328 17,375 18,186
(*) It includes non-operating income and expenses.
(**) Net result + depreciation and amortization.