Chrysler 2004 Annual Report Download - page 131
Download and view the complete annual report
Please find page 131 of the 2004 Chrysler annual report below. You can navigate through the pages in the report by either clicking on the pages listed below, or by using the keyword search tool below to find specific information within the annual report.-
 1
1 -
2
-
3
-
4
-
5
-
6
-
7
-
8
-
9
-
10
-
11
-
12
-
13
-
14
-
15
-
16
-
17
-
18
-
19
-
20
-
21
-
22
-
23
-
24
-
25
-
26
-
27
-
28
-
29
-
30
-
31
-
32
-
33
-
34
-
35
-
36
-
37
-
38
-
39
-
40
-
41
-
42
-
43
-
44
-
45
-
46
-
47
-
48
-
49
-
50
-
51
-
52
-
53
-
54
-
55
-
56
-
57
-
58
-
59
-
60
-
61
-
62
-
63
-
64
-
65
-
66
-
67
-
68
-
69
-
70
-
71
-
72
-
73
-
74
-
75
-
76
-
77
-
78
-
79
-
80
-
81
-
82
-
83
-
84
-
85
-
86
-
87
-
88
-
89
-
90
-
91
-
92
-
93
-
94
-
95
-
96
-
97
-
98
-
99
-
100
-
101
-
102
-
103
-
104
-
105
-
106
-
107
-
108
-
109
-
110
-
111
-
112
-
113
-
114
-
115
-
116
-
117
-
118
-
119
-
120
-
 121
121 -
 122
122 -
 123
123 -
 124
124 -
 125
125 -
 126
126 -
 127
127 -
 128
128 -
 129
129 -
 130
130 -
 131
131 -
 132
132 -
 133
133 -
 134
134 -
 135
135 -
 136
136 -
 137
137 -
 138
138 -
 139
139 -
 140
140 -
 141
141 -
142
-
143
-
144
-
145
-
146
-
147
-
148
-
149
-
150
-
151
-
152
-
153
-
154
-
155
-
156
-
157
-
158
-
159
-
160
-
161
-
162
-
163
-
164
-
165
-
166
-
167
-
168
-
169
-
170
-
171
-
172
-
173
-
174
-
175
-
176
-
177
-
178
-
179
-
180
-
181
-
182
-
183
-
184
-
185
-
186
-
187
-
188
-
189
-
190
-
191
-
192
-
193
-
194
-
195
-
196
-
197
-
198
-
199
-
200
-
201
-
202
-
203
-
204
-
205
-
206
-
207
-
208
-
209
-
210
-
211
-
212
-
213
-
214
-
215
-
216
-
217
-
218
-
219
-
220
-
221
-
222
-
223
-
224
-
225
-
226
-
227
 |
 |

129
Consolidated Financial Statements at December 31, 2004 – Notes to the Consolidated Financial Statements
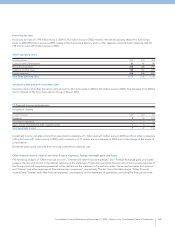
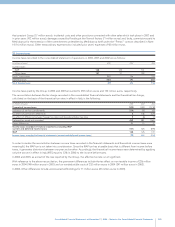
Provisions for risks
Provisions for risks of 1,394 million euros in 2004 (1,163 million euros in 2003) relate to the vehicle warranty reserve for 636 million
euros in 2004 (490 million euros in 2003), mainly in the Automotive Sectors, and to other reserves connected with industrial risks for
758 million euros (673 million euros in 2003).
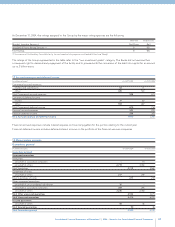
Other operating costs
(in millions of euros) 2004 2003 2002
Losses on sale of fixed assets 83 47 86
Prior period expenses 208 226 297
Indirect and other taxes 128 147 229
Sundry expenses 656 608 692
Total Other operating costs 1,075 1,028 1,304
Insurance claims and other insurance costs
Insurance claims and other insurance costs amount to 20 million euros in 2004 (1,367 million euros in 2003). The decrease from 2003 is
due to the sale of the Toro Assicurazioni Group in May 2, 2003.
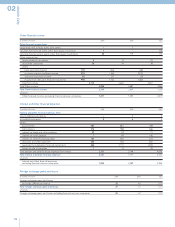
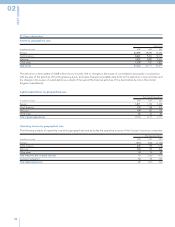
17 Financial income and expenses
Investment income
(in millions of euros) 2004 2003 2002
Dividends 912 103
Tax credit on dividends –522
Gains on sale of investments held in current assets –531
Total Investment income 922 156
Investment income includes income from associated companies of 1 million euros (1 million euros in 2003) and from other companies
of 8 million euros (21 million euros in 2003), with a reduction of 13 million euros compared to 2003 due to the change in the scope of
consolidation.
Dividends were mainly received from minority investments valued at cost.
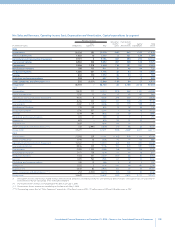
Other financial income, interest and other financial expenses, foreign exchange gains and losses
The following analysis of “Other financial income”, “Interest and other financial expenses” and “Foreign exchange gains and losses”
presents the amounts shown in the related captions on the statement of operations and also the amounts of income and expenses of
the Group’s financial companies presented in the captions on the statement of operations under “Revenues from sales and services”
and “Interest and other expenses of financial services companies”, respectively. The last line in the table shows “Other financial
income” and “Interest and other financial expenses” as presented on the statement of operations, excluding the financial activities.