Chrysler 2004 Annual Report Download - page 105
Download and view the complete annual report
Please find page 105 of the 2004 Chrysler annual report below. You can navigate through the pages in the report by either clicking on the pages listed below, or by using the keyword search tool below to find specific information within the annual report.-
 1
1 -
2
-
3
-
4
-
5
-
6
-
7
-
8
-
9
-
10
-
11
-
12
-
13
-
14
-
15
-
16
-
17
-
18
-
19
-
20
-
21
-
22
-
23
-
24
-
25
-
26
-
27
-
28
-
29
-
30
-
31
-
32
-
33
-
34
-
35
-
36
-
37
-
38
-
39
-
40
-
41
-
42
-
43
-
44
-
45
-
46
-
47
-
48
-
49
-
50
-
51
-
52
-
53
-
54
-
55
-
56
-
57
-
58
-
59
-
60
-
61
-
62
-
63
-
64
-
65
-
66
-
67
-
68
-
69
-
70
-
71
-
72
-
73
-
74
-
75
-
76
-
77
-
78
-
79
-
80
-
81
-
82
-
83
-
84
-
85
-
86
-
87
-
88
-
89
-
90
-
91
-
92
-
93
-
94
-
 95
95 -
 96
96 -
 97
97 -
 98
98 -
 99
99 -
 100
100 -
 101
101 -
 102
102 -
 103
103 -
 104
104 -
 105
105 -
 106
106 -
 107
107 -
 108
108 -
 109
109 -
 110
110 -
 111
111 -
 112
112 -
 113
113 -
 114
114 -
 115
115 -
116
-
117
-
118
-
119
-
120
-
121
-
122
-
123
-
124
-
125
-
126
-
127
-
128
-
129
-
130
-
131
-
132
-
133
-
134
-
135
-
136
-
137
-
138
-
139
-
140
-
141
-
142
-
143
-
144
-
145
-
146
-
147
-
148
-
149
-
150
-
151
-
152
-
153
-
154
-
155
-
156
-
157
-
158
-
159
-
160
-
161
-
162
-
163
-
164
-
165
-
166
-
167
-
168
-
169
-
170
-
171
-
172
-
173
-
174
-
175
-
176
-
177
-
178
-
179
-
180
-
181
-
182
-
183
-
184
-
185
-
186
-
187
-
188
-
189
-
190
-
191
-
192
-
193
-
194
-
195
-
196
-
197
-
198
-
199
-
200
-
201
-
202
-
203
-
204
-
205
-
206
-
207
-
208
-
209
-
210
-
211
-
212
-
213
-
214
-
215
-
216
-
217
-
218
-
219
-
220
-
221
-
222
-
223
-
224
-
225
-
226
-
227
 |
 |
103
Consolidated Financial Statements at December 31, 2004 – Notes to the Consolidated Financial Statements
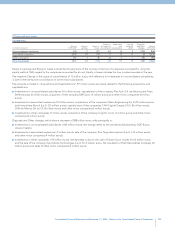
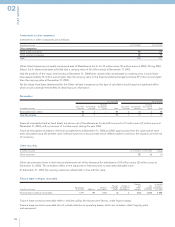
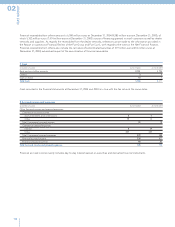
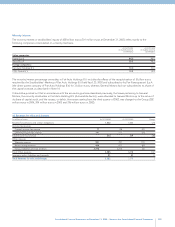
Investments in associated companies are as follows:
At 12/31/2004 At 12/31/2003
(in millions of euros) % Amount % Amount
Associated companies:
Fiat-GM Powertrain B.V. 50.0 1,258 50.0 1,172
Italenergia Bis S.p.A 24.6 514 24.6 512
Fidis Retail Italia S.p.A. 49.0 420 49.0 372
Tofas-Turk Otomobil Fabrikasi Tofas A.S. 37.9 183 37.9 156
Sevel S.p.A. 50.0 120 50.0 118
Rizzoli Corriere della Sera MediaGroup S.p.A. 9.8 101 9.8 99
Kobelco Construction Machinery Co. Ltd. 20.0 99 20.0 103
Naveco Ltd. 50.0 94 50.0 102
CNH Capital Europe S.a.S. 49.9 58 49.9 45
Société Européenne de Véhicules Légers du Nord-Sevelnord Société Anonyme 50.0 52 50.0 49
Consolidated Diesel Company 50.0 49 50.0 54
Jiangsu Nanya Auto Co. Ltd. 50.0 39 50.0 54
New Holland HFT Japan Inc. 50.0 30 50.0 32
Turk Traktor Ve Ziraat Makineleri A.S. 37.5 30 37.5 33
CBC-Iveco Ltd. 50.0 21 50.0 40
Immobiliare Novoli S.p.A. 40.0 21 ––
IPI S.p.A. 10.0 16 10.0 16
LBX Company LLC 50.0 16 50.0 15
Transolver Finance Establecimiento Financiero de Credito S.A. 50.0 15 50.0 14
Global Value Services S.p.A. 50.0 14 50.0 36
New Holland Trakmak Traktor A.S. 37.5 13 37.5 14
Maire Engineering S.p.A. 30.0 12 ––
Al-Ghazi Tractors Ltd. 43.2 12 43.2 12
Hua Dong Teksid Automotive Foundry Co. Ltd. 50.0 7 50.0 7
CNH de Mexico SA de CV 50.0 7 50.0 6
Toro Targa Assicurazioni S.p.A. ––49.0 13
Other associated companies 129 128
Total 3,330 3,202
The above list also comprises certain companies under joint control, the most important of which are Fiat-GM Powertrain B.V., Sevel
S.p.A., Société Européenne de Véhicules Légers du Nord-Sevelnord Société Anonyme and Naveco Ltd. Such companies carry a
negative net financial position of 1,203 million euros (negative of 1,093 million euros at December 31, 2003).
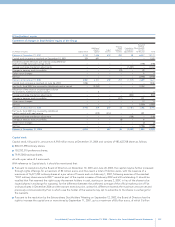
Fiat-GM Powertrain B.V.
Fiat-GM Powertrain B.V. is an industrial joint venture for the manufacture of engines and gears for cars that was set up in the second
half of 2001 between Fiat and General Motors Corporation (General Motors) under the well-known strategic alliance. The key figures
taken from the financial statements of Fiat-GM Powertrain, drawn up in accordance with the accounting principles of the Group for
the valuation of the investment using the equity method at December 31, 2004 and 2003 are as follows:
(in millions of euros) At 12/31/2004 At 12/31/2003
Balance sheet data
Fixed assets 3,149 3,250
Total assets 6,581 6,611
Net indebtedness (1,273) (1,238)
Stockholders' equity 2,516 2,344