Chrysler 2004 Annual Report Download - page 130
Download and view the complete annual report
Please find page 130 of the 2004 Chrysler annual report below. You can navigate through the pages in the report by either clicking on the pages listed below, or by using the keyword search tool below to find specific information within the annual report.-
 1
1 -
2
-
3
-
4
-
5
-
6
-
7
-
8
-
9
-
10
-
11
-
12
-
13
-
14
-
15
-
16
-
17
-
18
-
19
-
20
-
21
-
22
-
23
-
24
-
25
-
26
-
27
-
28
-
29
-
30
-
31
-
32
-
33
-
34
-
35
-
36
-
37
-
38
-
39
-
40
-
41
-
42
-
43
-
44
-
45
-
46
-
47
-
48
-
49
-
50
-
51
-
52
-
53
-
54
-
55
-
56
-
57
-
58
-
59
-
60
-
61
-
62
-
63
-
64
-
65
-
66
-
67
-
68
-
69
-
70
-
71
-
72
-
73
-
74
-
75
-
76
-
77
-
78
-
79
-
80
-
81
-
82
-
83
-
84
-
85
-
86
-
87
-
88
-
89
-
90
-
91
-
92
-
93
-
94
-
95
-
96
-
97
-
98
-
99
-
100
-
101
-
102
-
103
-
104
-
105
-
106
-
107
-
108
-
109
-
110
-
111
-
112
-
113
-
114
-
115
-
116
-
117
-
118
-
119
-
 120
120 -
 121
121 -
 122
122 -
 123
123 -
 124
124 -
 125
125 -
 126
126 -
 127
127 -
 128
128 -
 129
129 -
 130
130 -
 131
131 -
 132
132 -
 133
133 -
 134
134 -
 135
135 -
 136
136 -
 137
137 -
 138
138 -
 139
139 -
 140
140 -
141
-
142
-
143
-
144
-
145
-
146
-
147
-
148
-
149
-
150
-
151
-
152
-
153
-
154
-
155
-
156
-
157
-
158
-
159
-
160
-
161
-
162
-
163
-
164
-
165
-
166
-
167
-
168
-
169
-
170
-
171
-
172
-
173
-
174
-
175
-
176
-
177
-
178
-
179
-
180
-
181
-
182
-
183
-
184
-
185
-
186
-
187
-
188
-
189
-
190
-
191
-
192
-
193
-
194
-
195
-
196
-
197
-
198
-
199
-
200
-
201
-
202
-
203
-
204
-
205
-
206
-
207
-
208
-
209
-
210
-
211
-
212
-
213
-
214
-
215
-
216
-
217
-
218
-
219
-
220
-
221
-
222
-
223
-
224
-
225
-
226
-
227
 |
 |

FIAT GROUP
02
128
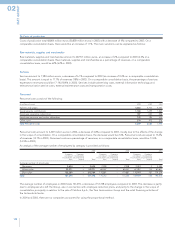
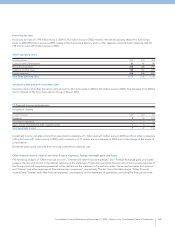
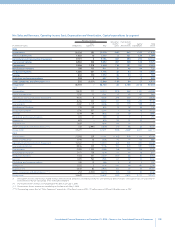
16 Costs of production
Costs of production total 48,804 million euros (50,858 million euros in 2003) with a decrease of 4% compared to 2003. On a
comparable consolidation basis, there would be an increase of 1.1%. The main variations can be explained as follows:
Raw materials, supplies and merchandise
Raw materials, supplies and merchandise amount to 28,951 million euros, an increase of 2% compared to 2003 (2.3% on a
comparable consolidation basis). Raw materials, supplies and merchandise as a percentage of revenues, on a comparable
consolidation basis, would be 62% (63% in 2003).
Services
Services amount to 7,984 million euros, a decrease of 6.1% compared to 2003 (an increase of 0.4% on a comparable consolidation
basis). This amount is equal to 17.1% of revenues (18% in 2003). On a comparable consolidation basis, the percentage of services
expenses to revenues would be 17.1% (18.4% in 2003). Services include advertising costs, external information technology and
telecommunication service costs, external maintenance costs and transportation costs.
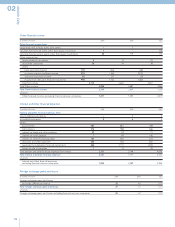
Personnel
Personnel costs consist of the following:
(in millions of euros) 2004 2003 2002
Salaries and wages 4,462 4,707 5,457
Social security contributions 1,168 1,249 1,365
Employee severance indemnities 187 244 256
Employee pensions and similar obligations 178 185 100
Other costs 374 303 376
Total Personnel costs 6,369 6,688 7,554
Personnel costs amount to 6,369 million euros in 2004, a decrease of 4.8% compared to 2003, mostly due to the effects of the change
in the scope of consolidation. On a comparable consolidation basis, the decrease would be 2.4%. Personnel costs are equal to 13.6%
of revenues (14.1% in 2003). Personnel costs as a percentage of revenues, on a comparable consolidation basis, would be 13.6%
(14.5% in 2003).
An analysis of the average number of employees by category is provided as follows:
2004 2003 2002
Companies Companies Companies Companies Companies Companies
consolidated consolidated by consolidated consolidated by consolidated consolidated by
on a line-by-line the proportional on a line-by-line the proportional on a line-by-line the proportional
basis method
Total
basis method
Total
basis method
Total
Average number of employees
Managers 2,634 – 2,634 2,948 – 2,948 3,483 2 3,485
White-collar 53,271 – 53,271 60,407 – 60,407 67,487 114 67,601
Blue-collar 105,589 – 105,589 110,887 – 110,887 118,999 320 119,319
Total 161,494 – 161,494 174,242 – 174,242 189,969 436 190,405
The average number of employees in 2004 totals 161,494, a decrease of 12,748 employees compared to 2003. This decrease is partly
due to employees who left the Group, also in connection with employee reduction plans, and partly to the change in the scope of
consolidation principally in relation to the sale of FiatAvio S.p.A., the Toro Assicurazioni Group and the retail financing activities of
the Automobile Sector.
In 2004 and 2003, there are no companies accounted for using the proportional method.