Chrysler 2004 Annual Report Download - page 72
Download and view the complete annual report
Please find page 72 of the 2004 Chrysler annual report below. You can navigate through the pages in the report by either clicking on the pages listed below, or by using the keyword search tool below to find specific information within the annual report.-
 1
1 -
2
-
3
-
4
-
5
-
6
-
7
-
8
-
9
-
10
-
11
-
12
-
13
-
14
-
15
-
16
-
17
-
18
-
19
-
20
-
21
-
22
-
23
-
24
-
25
-
26
-
27
-
28
-
29
-
30
-
31
-
32
-
33
-
34
-
35
-
36
-
37
-
38
-
39
-
40
-
41
-
42
-
43
-
44
-
45
-
46
-
47
-
48
-
49
-
50
-
51
-
52
-
53
-
54
-
55
-
56
-
57
-
58
-
59
-
60
-
61
-
 62
62 -
 63
63 -
 64
64 -
 65
65 -
 66
66 -
 67
67 -
 68
68 -
 69
69 -
 70
70 -
 71
71 -
 72
72 -
 73
73 -
 74
74 -
 75
75 -
 76
76 -
 77
77 -
 78
78 -
 79
79 -
 80
80 -
 81
81 -
 82
82 -
83
-
84
-
85
-
86
-
87
-
88
-
89
-
90
-
91
-
92
-
93
-
94
-
95
-
96
-
97
-
98
-
99
-
100
-
101
-
102
-
103
-
104
-
105
-
106
-
107
-
108
-
109
-
110
-
111
-
112
-
113
-
114
-
115
-
116
-
117
-
118
-
119
-
120
-
121
-
122
-
123
-
124
-
125
-
126
-
127
-
128
-
129
-
130
-
131
-
132
-
133
-
134
-
135
-
136
-
137
-
138
-
139
-
140
-
141
-
142
-
143
-
144
-
145
-
146
-
147
-
148
-
149
-
150
-
151
-
152
-
153
-
154
-
155
-
156
-
157
-
158
-
159
-
160
-
161
-
162
-
163
-
164
-
165
-
166
-
167
-
168
-
169
-
170
-
171
-
172
-
173
-
174
-
175
-
176
-
177
-
178
-
179
-
180
-
181
-
182
-
183
-
184
-
185
-
186
-
187
-
188
-
189
-
190
-
191
-
192
-
193
-
194
-
195
-
196
-
197
-
198
-
199
-
200
-
201
-
202
-
203
-
204
-
205
-
206
-
207
-
208
-
209
-
210
-
211
-
212
-
213
-
214
-
215
-
216
-
217
-
218
-
219
-
220
-
221
-
222
-
223
-
224
-
225
-
226
-
227
 |
 |
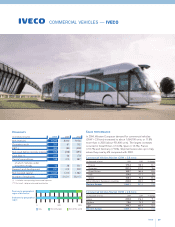
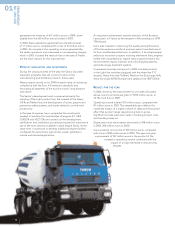
New registrations of light commercial vehicles (GVW between 2.8
and 6 tons) grew to 749,630, for a healthy increase of 13.4%
compared with the 660,900 units sold in 2003. While demand was
up in all European markets, the gains were particularly strong in
Great Britain (+20.7), Spain (+18.1%) and France (+13.3%).
Demand for medium vehicles (GVW between 6.1 and 15.9 tons)
also improved, rising to 78,621 units (+5.8% compared with
2003). All of the European markets benefited from the increase
in demand, including Germany, where the market expanded
at a sustained rate of 11.3%. The exception was Italy, where
shipments were down a modest 0.8% compared with 2003.
New registrations of heavy vehicles (GVW > 16 tons) grew to
235,837 units, or 9.1% more than in 2003. The best gains were
recorded in Germany (+16.7%), Spain (+7.7%) and France
(+4.6%). Demand held relatively steady in Italy (+3.3%), declined
slightly in Great Britain (-1.2%) and was generally up in all of the
remaining markets.
In Western Europe, the bus market expanded to 24,493 units,
or 2.9% more than in 2003 (23,805 vehicles). This improvement
is the net result of a positive trend in Italy (+19.2%) and Spain
(+9.4%), offset in part by a contraction in Germany (-5.7%) and
France (-2.4%). Demand was unchanged in Great Britain.
Iveco’s share of the Western European market for vehicles with
a curb weight of 2.8 tons or more was 11.1% (0.4 percentage
points less than in 2003), due mainly to weakness in Iveco’s
main markets, where the Sector’s share went from 13% in 2003
to 12.6% in 2004.
Iveco’s market share decreased from 9.8% to 9.3% in the
light-vehicle segment, but improved to 28.2% (+0.8 percentage
points) in the medium-vehicle segment, where Iveco was again
the European market leader thanks to the contribution of the
New Eurocargo, which it launched in 2003. At 11.1%, Iveco’s
REPORT ON
OPERATIONS
01
70
Sales Performance –Units Sold by Country
(in thousands of units) 2004 2003 % change
France 20.4 17.8 14.6
Germany 16.3 14.0 16.5
Great Britain 14.6 13.8 5.9
Italy 38.7 38.3 1.1
Spain 16.8 14.8 13.4
Rest of Western Europe 22.4 20.6 8.7
Western Europe 129.2 119.3 8.3
Eastern Europe 10.8 9.7 11.9
Rest of the world 22.3 17.5 27.7
Total units sold 162.3 146.4 10.9
Associated companies 57.5 49.6 16.0
Grand total 219.8 196.0 12.2