Chrysler 2004 Annual Report Download - page 12
Download and view the complete annual report
Please find page 12 of the 2004 Chrysler annual report below. You can navigate through the pages in the report by either clicking on the pages listed below, or by using the keyword search tool below to find specific information within the annual report.-
 1
1 -
 2
2 -
 3
3 -
 4
4 -
 5
5 -
 6
6 -
 7
7 -
 8
8 -
 9
9 -
 10
10 -
 11
11 -
 12
12 -
 13
13 -
 14
14 -
 15
15 -
 16
16 -
 17
17 -
 18
18 -
 19
19 -
 20
20 -
 21
21 -
 22
22 -
23
-
24
-
25
-
26
-
27
-
28
-
29
-
30
-
31
-
32
-
33
-
34
-
35
-
36
-
37
-
38
-
39
-
40
-
41
-
42
-
43
-
44
-
45
-
46
-
47
-
48
-
49
-
50
-
51
-
52
-
53
-
54
-
55
-
56
-
57
-
58
-
59
-
60
-
61
-
62
-
63
-
64
-
65
-
66
-
67
-
68
-
69
-
70
-
71
-
72
-
73
-
74
-
75
-
76
-
77
-
78
-
79
-
80
-
81
-
82
-
83
-
84
-
85
-
86
-
87
-
88
-
89
-
90
-
91
-
92
-
93
-
94
-
95
-
96
-
97
-
98
-
99
-
100
-
101
-
102
-
103
-
104
-
105
-
106
-
107
-
108
-
109
-
110
-
111
-
112
-
113
-
114
-
115
-
116
-
117
-
118
-
119
-
120
-
121
-
122
-
123
-
124
-
125
-
126
-
127
-
128
-
129
-
130
-
131
-
132
-
133
-
134
-
135
-
136
-
137
-
138
-
139
-
140
-
141
-
142
-
143
-
144
-
145
-
146
-
147
-
148
-
149
-
150
-
151
-
152
-
153
-
154
-
155
-
156
-
157
-
158
-
159
-
160
-
161
-
162
-
163
-
164
-
165
-
166
-
167
-
168
-
169
-
170
-
171
-
172
-
173
-
174
-
175
-
176
-
177
-
178
-
179
-
180
-
181
-
182
-
183
-
184
-
185
-
186
-
187
-
188
-
189
-
190
-
191
-
192
-
193
-
194
-
195
-
196
-
197
-
198
-
199
-
200
-
201
-
202
-
203
-
204
-
205
-
206
-
207
-
208
-
209
-
210
-
211
-
212
-
213
-
214
-
215
-
216
-
217
-
218
-
219
-
220
-
221
-
222
-
223
-
224
-
225
-
226
-
227
 |
 |

REPORT ON
OPERATIONS
01
HIGHLIGHTS OF RESULTS
STATISTICAL DATA BY GEOGRAPHICAL REGION
Number of Number of Number of Number of
Companies Employees
Facilities
R&D Centers
Italy 173 71,329 54 52
Europe excluding Italy
291 42,879 56 33
North America 89 12,400 28 17
Mercosur 43 24,229 19 10
Other regions 104 9,712 23 9
Total 700 160,549 180 121
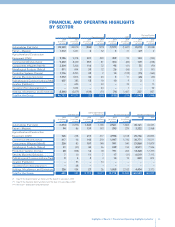
FINANCIAL AND OPERATING HIGHLIGHTS OF THE FIAT GROUP
(in millions of euros) 2004 2003 2002 2001 2000
Consolidated revenues 46,703 47,271 55,649 58,006 57,555
Operating result 22 (510) (762) 318 855
EBITDA 1,335 1,950 (1,341) 3,408 5,125
EBIT (833) (319) (3,955) 528 2,073
Result before taxes (1,577) (1,298) (4,817) (497) 1,050
Net result before minority interest (1,548) (1,948) (4,263) (791) 578
Group interest in net result (1,586) (1,900) (3,948) (445) 664
Net financial position positive/(negative) (4,961) (3,028) (3,780) (6,035) (6,467)
Stockholders’ equity before minority interest 5,757 7,494 8,679 13,607 15,209
Group interest in stockholders’ equity 5,099 6,793 7,641 12,170 13,320
Net invested capital 10,718 10,522 12,459 19,642 21,676
Operating cash flow (Operating result plus depreciation
and amortization) 2,190 1,759 1,852 3,198 3,907
Cash flow (Net result before minority interest plus depreciation
and amortization) 620 321 (1,649) 2,089 3,630
Investments 2,349 2,499 3,289 3,911 3,757
of which in fixed assets 2,112 2,011 2,771 3,438 3,236
Research and development 1,810 1,747 1,748 1,817 1,725
Operating result/net revenues (ROS) –(1.1%) (1.4%) 0.5% 1.5%
Operating result/average net invested capital (ROI) 0.2% (4.4%) (4.7%) 1.5% 4.2%
Net result before minority interest/net revenues (3.3%) (4.1%) (7.7%) (1.4%) 1.0%
Net result/Group interest in average stockholders’equity (ROE) (26.7%) (26.3%) (39.9%) (3.5%) 5.1%
Investments (Fixed assets)/depreciation 1.25 1.15 1.37 1.50 1.28
Number of employees 160,549 162,237 186,492 198,764 223,953