Chrysler 2004 Annual Report Download - page 129
Download and view the complete annual report
Please find page 129 of the 2004 Chrysler annual report below. You can navigate through the pages in the report by either clicking on the pages listed below, or by using the keyword search tool below to find specific information within the annual report.-
 1
1 -
2
-
3
-
4
-
5
-
6
-
7
-
8
-
9
-
10
-
11
-
12
-
13
-
14
-
15
-
16
-
17
-
18
-
19
-
20
-
21
-
22
-
23
-
24
-
25
-
26
-
27
-
28
-
29
-
30
-
31
-
32
-
33
-
34
-
35
-
36
-
37
-
38
-
39
-
40
-
41
-
42
-
43
-
44
-
45
-
46
-
47
-
48
-
49
-
50
-
51
-
52
-
53
-
54
-
55
-
56
-
57
-
58
-
59
-
60
-
61
-
62
-
63
-
64
-
65
-
66
-
67
-
68
-
69
-
70
-
71
-
72
-
73
-
74
-
75
-
76
-
77
-
78
-
79
-
80
-
81
-
82
-
83
-
84
-
85
-
86
-
87
-
88
-
89
-
90
-
91
-
92
-
93
-
94
-
95
-
96
-
97
-
98
-
99
-
100
-
101
-
102
-
103
-
104
-
105
-
106
-
107
-
108
-
109
-
110
-
111
-
112
-
113
-
114
-
115
-
116
-
117
-
118
-
 119
119 -
 120
120 -
 121
121 -
 122
122 -
 123
123 -
 124
124 -
 125
125 -
 126
126 -
 127
127 -
 128
128 -
 129
129 -
 130
130 -
 131
131 -
 132
132 -
 133
133 -
 134
134 -
 135
135 -
 136
136 -
 137
137 -
 138
138 -
 139
139 -
140
-
141
-
142
-
143
-
144
-
145
-
146
-
147
-
148
-
149
-
150
-
151
-
152
-
153
-
154
-
155
-
156
-
157
-
158
-
159
-
160
-
161
-
162
-
163
-
164
-
165
-
166
-
167
-
168
-
169
-
170
-
171
-
172
-
173
-
174
-
175
-
176
-
177
-
178
-
179
-
180
-
181
-
182
-
183
-
184
-
185
-
186
-
187
-
188
-
189
-
190
-
191
-
192
-
193
-
194
-
195
-
196
-
197
-
198
-
199
-
200
-
201
-
202
-
203
-
204
-
205
-
206
-
207
-
208
-
209
-
210
-
211
-
212
-
213
-
214
-
215
-
216
-
217
-
218
-
219
-
220
-
221
-
222
-
223
-
224
-
225
-
226
-
227
 |
 |

127
Consolidated Financial Statements at December 31, 2004 – Notes to the Consolidated Financial Statements
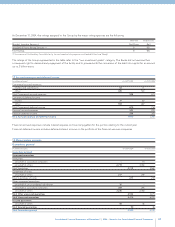
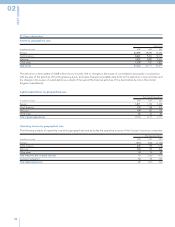
15 Value of production
Revenues from sales and services and Change in contract work in progress
Revenues from sales and services and Change in contract work in progress amount to 46,703 million euros in 2004 compared to
47,271 million euros in 2003. They include revenues from sales and services of 46,488 million euros (48,346 million euros in 2003)
and the change in contract work in progress of 215 million euros (-1,075 million euros in 2003).
For comments on these items, refer to the Report on operations.
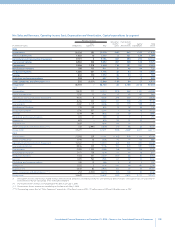
The Fiat Group is divided into business sectors and operates in various geographical areas. The distribution by business sector
of Revenues from sales and services and Change in contract work in progress (net of intra-Group transactions) is as follows:
(in millions of euros) 2004 2003 2002
Revenues from sales and services and Change in contract work in progress by operating sector
Automobiles 20,356 19,839 21,908
Ferrari and Maserati 1,502 1,250 1,194
Agricultural and Construction Equipment 9,791 9,410 10,502
Commercial Vehicles 8,960 8,206 8,816
Components 2,586 2,087 2,085
Metallurgical Products 798 735 1,411
Production Systems 1,285 1,756 1,763
Services 802 1,019 1,005
Publishing and Communications 398 372 346
Aviation (*) –625 1,532
Insurance (**) –1,654 4,834
Other companies 225 318 253
Total Revenues from sales and services and Change in contract work in progress 46,703 47,271 55,649
(*) The Aviation Sector’s revenues are included up to the date of sale (July 1, 2003).
(**) The Insurance Sector’s revenues are included up to the date of sale (May 2, 2003).
Net revenues by area of destination may be analyzed as follows:
(in millions of euros) 2004 2003 2002
Revenues from sales and services and Change in contract work in progress by destination
Italy 15,618 16,381 20,120
Europe (excluding Italy) 18,180 18,884 21,072
North America 5,857 5,920 7,411
Mercosur 3,196 2,595 3,268
Other areas 3,852 3,491 3,778
Total Revenues from sales and services and Change in contract work in progress 46,703 47,271 55,649
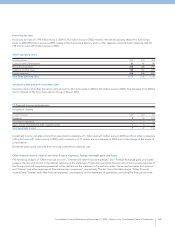
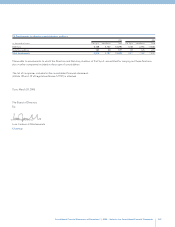
Other income and revenues
(in millions of euros) 2004 2003 2002
Revenue grants 54 52 47
Capital gains 87 187 290
Prior period income 345 423 518
Investment grants 61 78 114
Other income 969 949 1,183
Total Other income and revenues 1,516 1,689 2,152