Chrysler 2004 Annual Report Download - page 62
Download and view the complete annual report
Please find page 62 of the 2004 Chrysler annual report below. You can navigate through the pages in the report by either clicking on the pages listed below, or by using the keyword search tool below to find specific information within the annual report.-
 1
1 -
2
-
3
-
4
-
5
-
6
-
7
-
8
-
9
-
10
-
11
-
12
-
13
-
14
-
15
-
16
-
17
-
18
-
19
-
20
-
21
-
22
-
23
-
24
-
25
-
26
-
27
-
28
-
29
-
30
-
31
-
32
-
33
-
34
-
35
-
36
-
37
-
38
-
39
-
40
-
41
-
42
-
43
-
44
-
45
-
46
-
47
-
48
-
49
-
50
-
51
-
 52
52 -
 53
53 -
 54
54 -
 55
55 -
 56
56 -
 57
57 -
 58
58 -
 59
59 -
 60
60 -
 61
61 -
 62
62 -
 63
63 -
 64
64 -
 65
65 -
 66
66 -
 67
67 -
 68
68 -
 69
69 -
 70
70 -
 71
71 -
 72
72 -
73
-
74
-
75
-
76
-
77
-
78
-
79
-
80
-
81
-
82
-
83
-
84
-
85
-
86
-
87
-
88
-
89
-
90
-
91
-
92
-
93
-
94
-
95
-
96
-
97
-
98
-
99
-
100
-
101
-
102
-
103
-
104
-
105
-
106
-
107
-
108
-
109
-
110
-
111
-
112
-
113
-
114
-
115
-
116
-
117
-
118
-
119
-
120
-
121
-
122
-
123
-
124
-
125
-
126
-
127
-
128
-
129
-
130
-
131
-
132
-
133
-
134
-
135
-
136
-
137
-
138
-
139
-
140
-
141
-
142
-
143
-
144
-
145
-
146
-
147
-
148
-
149
-
150
-
151
-
152
-
153
-
154
-
155
-
156
-
157
-
158
-
159
-
160
-
161
-
162
-
163
-
164
-
165
-
166
-
167
-
168
-
169
-
170
-
171
-
172
-
173
-
174
-
175
-
176
-
177
-
178
-
179
-
180
-
181
-
182
-
183
-
184
-
185
-
186
-
187
-
188
-
189
-
190
-
191
-
192
-
193
-
194
-
195
-
196
-
197
-
198
-
199
-
200
-
201
-
202
-
203
-
204
-
205
-
206
-
207
-
208
-
209
-
210
-
211
-
212
-
213
-
214
-
215
-
216
-
217
-
218
-
219
-
220
-
221
-
222
-
223
-
224
-
225
-
226
-
227
 |
 |
REPORT ON
OPERATIONS
01
60
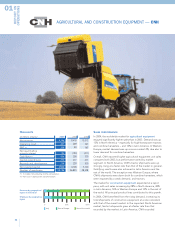
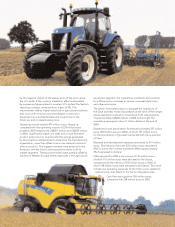
AUTOMOBILES — FIAT AUTO
SALES PERFORMANCE
In Western Europe, demand for automobiles increased by 2.1%
compared with 2003.
In some of Europe’s main markets, growth was almost in line
with the previous year. The same was not true in Great Britain,
where demand contracted slightly (-0.5%), and Spain, where, on
the contrary, shipments were up a healthy 9.8%. In Italy, demand
was little changed (+0.5%) from 2003.
Market trends shifted dramatically in Poland and Brazil,
reversing last year’s performances, with shipments decreasing
significantly in Poland (-10.1%) but increasing in Brazil (+8.5%).
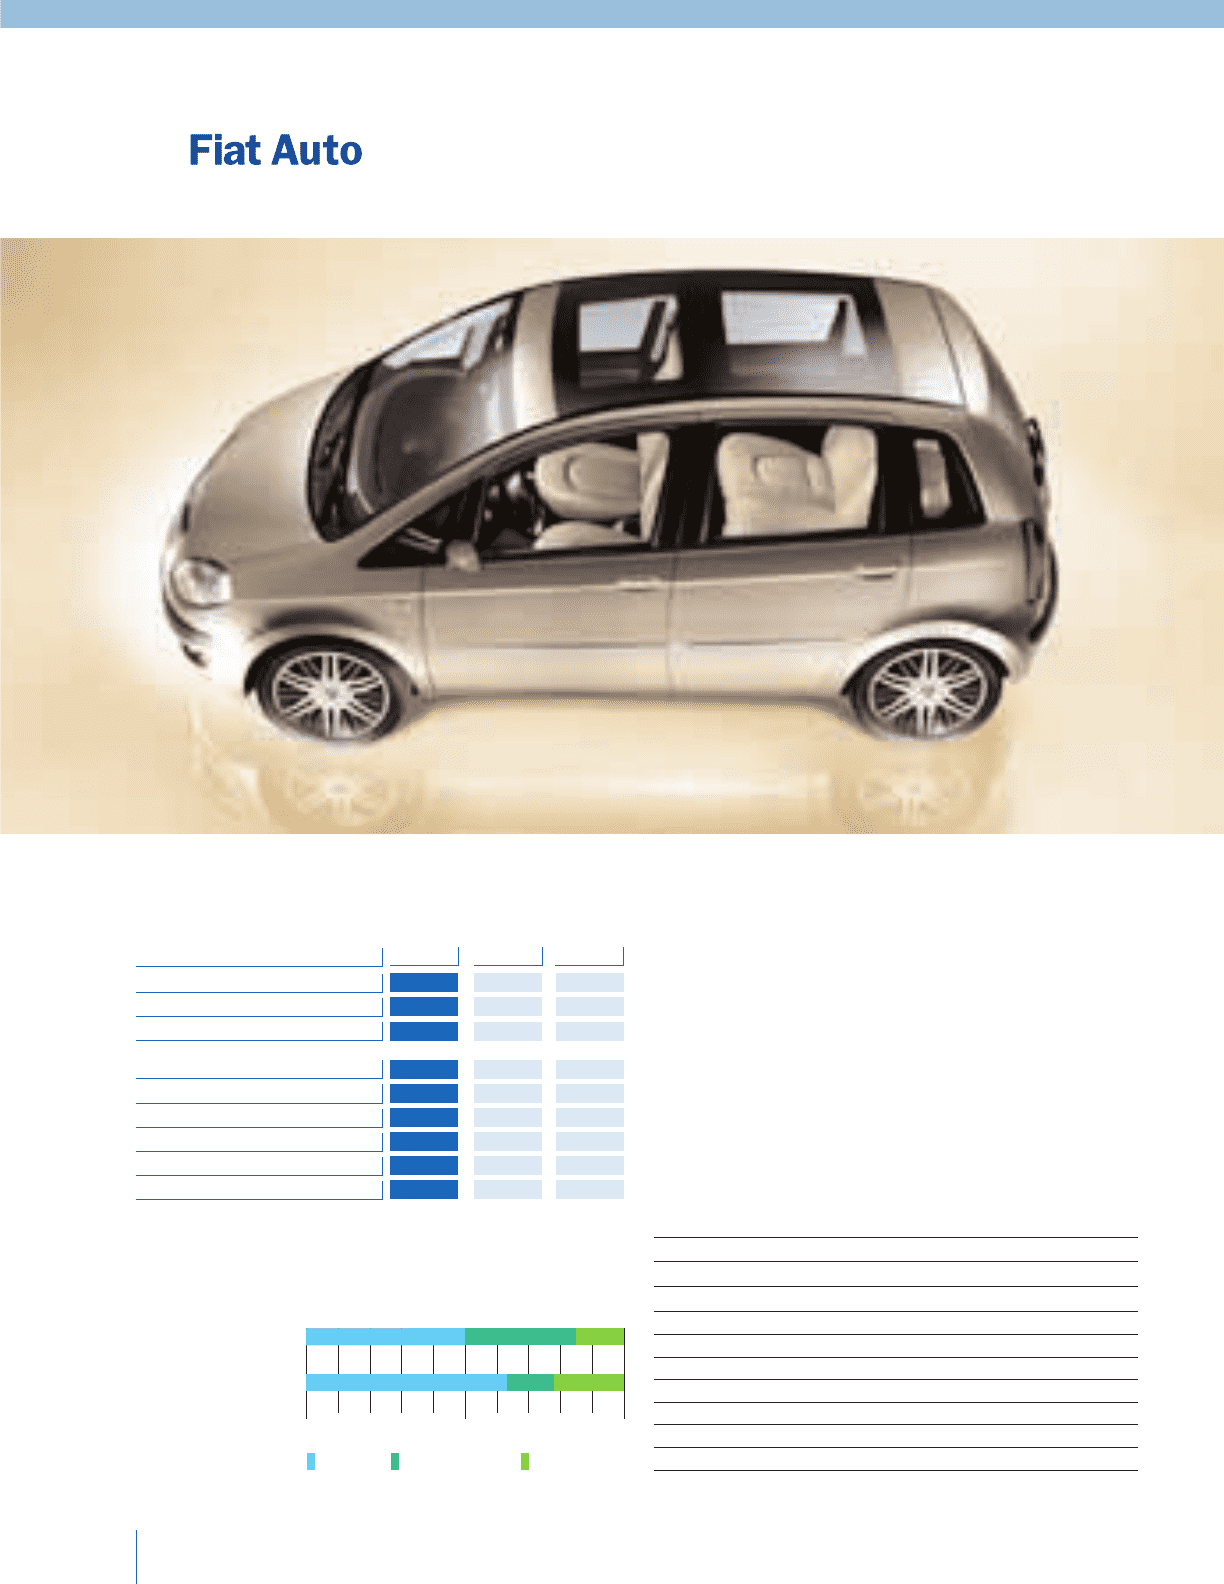
HIGHLIGHTS
Italy Rest of Europe Rest of the world
Revenues by geographical
region of destination
Employees by geographical
region
0 50% 100%
Automobile Market
(in thousands of units) 2004 2003 % change
France 2,005 2,003 0.1
Germany 3,194 3,174 0.7
Great Britain 2,573 2,586 (0.5)
Italy 2,259 2,247 0.5
Spain 1,514 1,380 9.8
Western Europe 14,439 14,145 2.1
Poland 318 354 (10.1)
Brazil 1,297 1,196 8.5
(in millions of euros) 2004 2003 2002
Net revenues 20,539 20,010 22,147
Operating result (840) (979) (1,343)
EBIT (*) (1,577) (1,607) (2,214)
Net result before
minority interest (2,019) (2,058) (2,739)
Cash flow (**) (1,074) (1,096) (1,780)
Capital expenditures 1,330 1,100 1,115
Research and development 990 939 861
Net invested capital 2,561 1,806 1,254
Number of employees 45,121 44,563 49,544
(*) Includes non-operating income and expenses.
(**) Net result + depreciation and amortization.