Chrysler 2004 Annual Report Download - page 41
Download and view the complete annual report
Please find page 41 of the 2004 Chrysler annual report below. You can navigate through the pages in the report by either clicking on the pages listed below, or by using the keyword search tool below to find specific information within the annual report.-
 1
1 -
2
-
3
-
4
-
5
-
6
-
7
-
8
-
9
-
10
-
11
-
12
-
13
-
14
-
15
-
16
-
17
-
18
-
19
-
20
-
21
-
22
-
23
-
24
-
25
-
26
-
27
-
28
-
29
-
30
-
 31
31 -
 32
32 -
 33
33 -
 34
34 -
 35
35 -
 36
36 -
 37
37 -
 38
38 -
 39
39 -
 40
40 -
 41
41 -
 42
42 -
 43
43 -
 44
44 -
 45
45 -
 46
46 -
 47
47 -
 48
48 -
 49
49 -
 50
50 -
 51
51 -
52
-
53
-
54
-
55
-
56
-
57
-
58
-
59
-
60
-
61
-
62
-
63
-
64
-
65
-
66
-
67
-
68
-
69
-
70
-
71
-
72
-
73
-
74
-
75
-
76
-
77
-
78
-
79
-
80
-
81
-
82
-
83
-
84
-
85
-
86
-
87
-
88
-
89
-
90
-
91
-
92
-
93
-
94
-
95
-
96
-
97
-
98
-
99
-
100
-
101
-
102
-
103
-
104
-
105
-
106
-
107
-
108
-
109
-
110
-
111
-
112
-
113
-
114
-
115
-
116
-
117
-
118
-
119
-
120
-
121
-
122
-
123
-
124
-
125
-
126
-
127
-
128
-
129
-
130
-
131
-
132
-
133
-
134
-
135
-
136
-
137
-
138
-
139
-
140
-
141
-
142
-
143
-
144
-
145
-
146
-
147
-
148
-
149
-
150
-
151
-
152
-
153
-
154
-
155
-
156
-
157
-
158
-
159
-
160
-
161
-
162
-
163
-
164
-
165
-
166
-
167
-
168
-
169
-
170
-
171
-
172
-
173
-
174
-
175
-
176
-
177
-
178
-
179
-
180
-
181
-
182
-
183
-
184
-
185
-
186
-
187
-
188
-
189
-
190
-
191
-
192
-
193
-
194
-
195
-
196
-
197
-
198
-
199
-
200
-
201
-
202
-
203
-
204
-
205
-
206
-
207
-
208
-
209
-
210
-
211
-
212
-
213
-
214
-
215
-
216
-
217
-
218
-
219
-
220
-
221
-
222
-
223
-
224
-
225
-
226
-
227
 |
 |

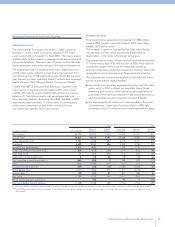
Operating Performance by Activity Segment
Industrial Activities
The net revenues for Industrial Activities in 2004, including
changes in contract work in progress, totaled 45,707 million
euros, up by 5.4% with respect to fiscal 2003. The improvement
is attributable to the increase in revenues at the automotive and
components Sectors. The revenues of Comau and the Services
Sector decreased due to the change in the scope of operations.
The operating result for Industrial Activities in 2004 was a loss
of 272 million euros, reflecting a significant improvement from
the operating loss of 938 million euros reported in the previous
year, thanks to a lower operating loss at Fiat Auto and improved
results at Iveco, CNH, Magneti Marelli, Comau, and Teksid.
In 2004, the EBIT of Industrial Activities was a negative 1,146
million euros, compared with the negative 476 million euros
in 2003, although that period had benefited from the positive
balance of 1,766 million euros in net gains/losses deriving
from disposal of assets. Excluding this effect, the EBIT in 2004
improved by approximately 1.1 billion euros in consequence
of the lower operating loss (666 million euros) and lower
non-operating expenses (432 million euros).
Financial Activities
Financial Activities generated net revenues of 1,883 million
euros in 2004, largely in line with those of 2003, when they
totaled 1,870 million euros.
The increase in revenues realized by Fiat Auto was offset by
the decrease at CNH, which was entirely attributable to
depreciation of the dollar with respect to the euro.
The income before taxes of Financial Activities totaled a positive
277 million euros (loss of 22 million euros in 2003, which did not
include the impact of the result of investments owned by
financial companies in industrial companies), thanks to the profits
realized by Financial Activities in all three automotive sectors.
The improvement is mainly attributable to Fiat Auto and Iveco,
whose income before taxes benefited:
■from lower non-operating expenses, down by over 100 million
euros, which in 2003 included, among other items, those
stemming from revision of the operating and organizational
processes of the renting companies in the Automobile Sector
and the residual loss stemming from the sale of Fraikin;
■the approximately 90 million euro improvement in the result
of investments, in particular Fiat Auto, which in 2003 had
sustained a loss of 76 million euros on the investment in Leasys.
39
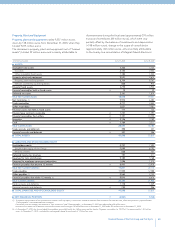
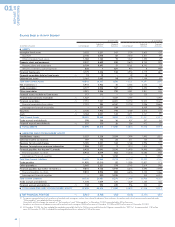
Financial Review of the Fiat Group and Fiat S.p.A.
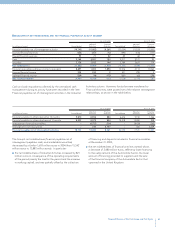
2004 2003
Industrial Financial Continuing Industrial Financial
(in millions of euros) Consolidated Activities Activities Operations Activities Activities
Net revenues 46,703 45,707 1,883 44,498 43,380 1,870
Cost of sales 39,623 39,319 1,191 38,468 37,985 1,235
Gross operating result 7,080 6,388 692 6,030 5,395 635
Overhead 4,629 4,333 296 4,509 4,186 323
Research and development 1,810 1,810 – 1,724 1,724 –
Other operating income (expenses) (619)(517)(102) (511) (423) (88)
Operating result 22 (272)294 (714) (938) 224
Investment income (expenses) (*) 8(18)26 (79) (16) (63)
Non-operating income (expenses) (**) (863)(856)(7) 359 478 (119)
EBIT (833)(1,146)313 (434) (476) 42
Financial income (expenses) (744)(708)(36) (1,067) (1,003) (64)
Result before taxes (1,577)(1,854)277 (1,501) (1,479) (22)
Income taxes (29)(120)91 541 486 55
Net result (1,548)(1,734)186 (2,042) (1,965) (77)
Result of intersegment investments – 186 – 90 13 (326)
Net result before minority interest (1,548)(1,548)186 (1,952) (1,952) (403)
(*) This item includes investment income (expenses) as well as write-downs and write-ups due to adjustments in non-intersegment equity investments valued using the equity method.
(**) The 2003 figure for Industrial Activities includes 1,766 million euros in net gains on disposals of assets, while the figure for Financial Activities includes a net loss on disposals of 24
million euros.