Chrysler 2004 Annual Report Download - page 136
Download and view the complete annual report
Please find page 136 of the 2004 Chrysler annual report below. You can navigate through the pages in the report by either clicking on the pages listed below, or by using the keyword search tool below to find specific information within the annual report.-
 1
1 -
2
-
3
-
4
-
5
-
6
-
7
-
8
-
9
-
10
-
11
-
12
-
13
-
14
-
15
-
16
-
17
-
18
-
19
-
20
-
21
-
22
-
23
-
24
-
25
-
26
-
27
-
28
-
29
-
30
-
31
-
32
-
33
-
34
-
35
-
36
-
37
-
38
-
39
-
40
-
41
-
42
-
43
-
44
-
45
-
46
-
47
-
48
-
49
-
50
-
51
-
52
-
53
-
54
-
55
-
56
-
57
-
58
-
59
-
60
-
61
-
62
-
63
-
64
-
65
-
66
-
67
-
68
-
69
-
70
-
71
-
72
-
73
-
74
-
75
-
76
-
77
-
78
-
79
-
80
-
81
-
82
-
83
-
84
-
85
-
86
-
87
-
88
-
89
-
90
-
91
-
92
-
93
-
94
-
95
-
96
-
97
-
98
-
99
-
100
-
101
-
102
-
103
-
104
-
105
-
106
-
107
-
108
-
109
-
110
-
111
-
112
-
113
-
114
-
115
-
116
-
117
-
118
-
119
-
120
-
121
-
122
-
123
-
124
-
125
-
 126
126 -
 127
127 -
 128
128 -
 129
129 -
 130
130 -
 131
131 -
 132
132 -
 133
133 -
 134
134 -
 135
135 -
 136
136 -
 137
137 -
 138
138 -
 139
139 -
 140
140 -
 141
141 -
 142
142 -
 143
143 -
 144
144 -
 145
145 -
 146
146 -
147
-
148
-
149
-
150
-
151
-
152
-
153
-
154
-
155
-
156
-
157
-
158
-
159
-
160
-
161
-
162
-
163
-
164
-
165
-
166
-
167
-
168
-
169
-
170
-
171
-
172
-
173
-
174
-
175
-
176
-
177
-
178
-
179
-
180
-
181
-
182
-
183
-
184
-
185
-
186
-
187
-
188
-
189
-
190
-
191
-
192
-
193
-
194
-
195
-
196
-
197
-
198
-
199
-
200
-
201
-
202
-
203
-
204
-
205
-
206
-
207
-
208
-
209
-
210
-
211
-
212
-
213
-
214
-
215
-
216
-
217
-
218
-
219
-
220
-
221
-
222
-
223
-
224
-
225
-
226
-
227
 |
 |

FIAT GROUP
02
134
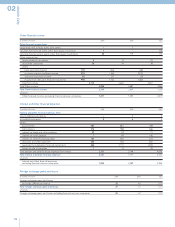
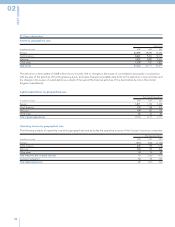
21 Other information
Assets by geographical area
Total Assets
(in millions of euros) 2004 2003 2002
Europe 43,996 49,690 75,254
North America 8,661 9,200 12,013
Mercosur 3,207 2,890 3,451
Other areas 1,379 931 1,803
Total Assets 57,243 62,711 92,521
The reduction in total assets of 5,468 million euros is mainly due to changes in the scope of consolidation principally in conjunction
with the sale of the activities of Fiat Engineering S.p.A. and lower financial receivables due both to the reduction in loan activities and
the change in the scope of consolidation as a result of the sale of the financial activities of the Automobile Sector in the United
Kingdom (see Note 6).
Capital expenditures by geographical area
Total Capital Expenditures
(in millions of euros) 2004 2003 2002
Europe 1,811 1,723 2,225
North America 170 138 313
Mercosur 104 120 150
Other areas 27 30 83
Total Capital expenditures 2,112 2,011 2,771
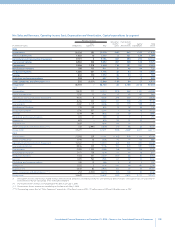
Operating income by geographical area
The following analysis of operating income by geographical area excludes the operating income of the Group’s insurance companies.
Total Operating Income
(in millions of euros) 2004 2003 2002
Europe (713) (832) (1,136)
North America 375 139 (118)
Mercosur 334 135 260
Other areas 14 (5) 89
Total Industrial and Financial activities 10 (563) (905)
Insurance companies 12 53 143
Total Operating income 22 (510) (762)