Chrysler 2004 Annual Report Download - page 31
Download and view the complete annual report
Please find page 31 of the 2004 Chrysler annual report below. You can navigate through the pages in the report by either clicking on the pages listed below, or by using the keyword search tool below to find specific information within the annual report.-
 1
1 -
2
-
3
-
4
-
5
-
6
-
7
-
8
-
9
-
10
-
11
-
12
-
13
-
14
-
15
-
16
-
17
-
18
-
19
-
20
-
 21
21 -
 22
22 -
 23
23 -
 24
24 -
 25
25 -
 26
26 -
 27
27 -
 28
28 -
 29
29 -
 30
30 -
 31
31 -
 32
32 -
 33
33 -
 34
34 -
 35
35 -
 36
36 -
 37
37 -
 38
38 -
 39
39 -
 40
40 -
 41
41 -
42
-
43
-
44
-
45
-
46
-
47
-
48
-
49
-
50
-
51
-
52
-
53
-
54
-
55
-
56
-
57
-
58
-
59
-
60
-
61
-
62
-
63
-
64
-
65
-
66
-
67
-
68
-
69
-
70
-
71
-
72
-
73
-
74
-
75
-
76
-
77
-
78
-
79
-
80
-
81
-
82
-
83
-
84
-
85
-
86
-
87
-
88
-
89
-
90
-
91
-
92
-
93
-
94
-
95
-
96
-
97
-
98
-
99
-
100
-
101
-
102
-
103
-
104
-
105
-
106
-
107
-
108
-
109
-
110
-
111
-
112
-
113
-
114
-
115
-
116
-
117
-
118
-
119
-
120
-
121
-
122
-
123
-
124
-
125
-
126
-
127
-
128
-
129
-
130
-
131
-
132
-
133
-
134
-
135
-
136
-
137
-
138
-
139
-
140
-
141
-
142
-
143
-
144
-
145
-
146
-
147
-
148
-
149
-
150
-
151
-
152
-
153
-
154
-
155
-
156
-
157
-
158
-
159
-
160
-
161
-
162
-
163
-
164
-
165
-
166
-
167
-
168
-
169
-
170
-
171
-
172
-
173
-
174
-
175
-
176
-
177
-
178
-
179
-
180
-
181
-
182
-
183
-
184
-
185
-
186
-
187
-
188
-
189
-
190
-
191
-
192
-
193
-
194
-
195
-
196
-
197
-
198
-
199
-
200
-
201
-
202
-
203
-
204
-
205
-
206
-
207
-
208
-
209
-
210
-
211
-
212
-
213
-
214
-
215
-
216
-
217
-
218
-
219
-
220
-
221
-
222
-
223
-
224
-
225
-
226
-
227
 |
 |

29
Financial Review of the Fiat Group and Fiat S.p.A.
The greatest increases were posted in North America and Latin
America, while sales declined in Western Europe from a year
earlier.
■Iveco had revenues of 9,292 million euros in 2004, up
by 10.1% from the 8,440 million euros in 2003, mainly
in consequence of the significant increase in volumes.
Approximately 162,300 units were sold, up by 10.9% from the
previous year, and 129,200 of these units were sold in Western
European countries, for an increase of 8.3%. Expanding
demand in Europe stimulated the strong performance of the
Sector, which reported sales increases on all of its principal
markets. The greatest gains were realized in France (+14.6%),
Germany (+16.5%), and Spain (+13.4%). In the medium range
vehicle segment, the Sector increased its share while
maintaining its position as market leader in Western Europe,
thanks to the New Eurocargo model. In contrast, the market
share of Iveco contracted slightly in the light and heavy range
vehicle segments.
■Magneti Marelli had revenues of 3,804 million euros in 2004.
The 18.7% increase from the previous year stemmed largely
from the change in the scope of operations: effective January
1, 2004, the Sector consolidated the Electronic Systems
business. On a comparable consolidation and foreign
exchange basis, revenues increased by 6%, driven mainly
by technological improvements of its products. In particular,
production of the Diesel Buy system was launched in the
Engine Control area, together with that of new headlights in
the Lighting area. The Suspension business reported higher
volumes, particularly in Poland, connected with the
production of new models by Fiat Auto.
■Teksid closed the year with revenues of 911 million euros,
up by +7.9% from the previous year in consequence of the
higher volumes that more than offset the negative foreign
exchange effect. The Cast Iron Business benefited from
higher demand in North America and Brazil, posting an
11% increase in activity. Sales volumes were positive at
the Magnesium Business Unit as well (+4.9%) thanks to
the increase in sales in Europe and its strong presence
on the North American market.
■Comau, with revenues of 1,716 million euros, reported a
25.2% downturn in revenues with respect to the previous
year, largely due to the transfer to Fiat Auto and Fiat-GM
Powertrain of its Service and Molding activities. On a
comparable basis and excluding the negative foreign
exchange effect, revenues fell by 9%, largely on account
of the decrease in the NAFTA area in consequence of
lower contract work commitments received in 2003.
■Business Solutions reported revenues of 1,572 million euros,
down by 13.4% from the previous fiscal year. This decrease
stemmed mainly from the sale of Fiat Engineering, which
was only partially offset by consolidation of the activities
of the Atlanet telephone company. On a comparable
consolidation basis, revenues were substantially the same
as in 2003.
■Itedi reported revenues of 407 million euros, 6.3% higher
than in fiscal 2003. This improvement derived from higher
advertising revenues, sales of the weekly magazine
“Specchio,” and brand-stretching initiatives, which offset
the decrease stemming from lower daily newspaper sales.
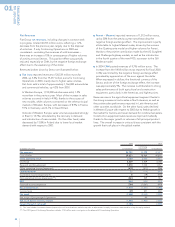
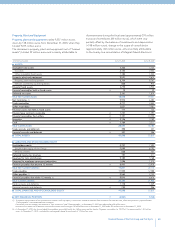
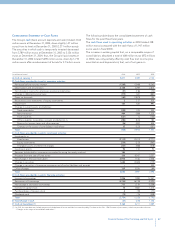
2004 2003 Change with
respect to the
Continuing Continuing
(in millions of euros) Consolidated Operations Consolidated Operations
Automobiles (Fiat Auto) 20,539 19,477 20,010 1,062
Ferrari – Maserati 1,512 1,261 1,261 251
Agricultural and Construction Equipment (CNH) 9,796 9,418 9,418 378
Commercial Vehicles (Iveco) 9,292 8,440 8,440 852
Components (Magneti Marelli) 3,804 3,206 3,206 598
Metallurgical Products (Teksid) 911 844 844 67
Production Systems (Comau) 1,716 2,293 2,293 (577)
Services (Business Solutions) 1,572 1,816 1,816 (244)
Publishing and Communications (Itedi) 407 383 383 24
Aviation (FiatAvio) (*) –– 625 –
Insurance (Toro Assicurazioni) (**) –– 1,654 –
Holdings, Miscellaneous and Eliminations (2,846) (2,640) (2,679) (206)
Total 46,703 44,498 47,271 2,205
(*) Revenues for the Aviation Sector are shown until the date of its sale (July 1, 2003).
(**) Revenues for the Insurance Sector are shown until the date of its sale (May 2, 2003).