Chrysler 2004 Annual Report Download - page 40
Download and view the complete annual report
Please find page 40 of the 2004 Chrysler annual report below. You can navigate through the pages in the report by either clicking on the pages listed below, or by using the keyword search tool below to find specific information within the annual report.-
 1
1 -
2
-
3
-
4
-
5
-
6
-
7
-
8
-
9
-
10
-
11
-
12
-
13
-
14
-
15
-
16
-
17
-
18
-
19
-
20
-
21
-
22
-
23
-
24
-
25
-
26
-
27
-
28
-
29
-
 30
30 -
 31
31 -
 32
32 -
 33
33 -
 34
34 -
 35
35 -
 36
36 -
 37
37 -
 38
38 -
 39
39 -
 40
40 -
 41
41 -
 42
42 -
 43
43 -
 44
44 -
 45
45 -
 46
46 -
 47
47 -
 48
48 -
 49
49 -
 50
50 -
51
-
52
-
53
-
54
-
55
-
56
-
57
-
58
-
59
-
60
-
61
-
62
-
63
-
64
-
65
-
66
-
67
-
68
-
69
-
70
-
71
-
72
-
73
-
74
-
75
-
76
-
77
-
78
-
79
-
80
-
81
-
82
-
83
-
84
-
85
-
86
-
87
-
88
-
89
-
90
-
91
-
92
-
93
-
94
-
95
-
96
-
97
-
98
-
99
-
100
-
101
-
102
-
103
-
104
-
105
-
106
-
107
-
108
-
109
-
110
-
111
-
112
-
113
-
114
-
115
-
116
-
117
-
118
-
119
-
120
-
121
-
122
-
123
-
124
-
125
-
126
-
127
-
128
-
129
-
130
-
131
-
132
-
133
-
134
-
135
-
136
-
137
-
138
-
139
-
140
-
141
-
142
-
143
-
144
-
145
-
146
-
147
-
148
-
149
-
150
-
151
-
152
-
153
-
154
-
155
-
156
-
157
-
158
-
159
-
160
-
161
-
162
-
163
-
164
-
165
-
166
-
167
-
168
-
169
-
170
-
171
-
172
-
173
-
174
-
175
-
176
-
177
-
178
-
179
-
180
-
181
-
182
-
183
-
184
-
185
-
186
-
187
-
188
-
189
-
190
-
191
-
192
-
193
-
194
-
195
-
196
-
197
-
198
-
199
-
200
-
201
-
202
-
203
-
204
-
205
-
206
-
207
-
208
-
209
-
210
-
211
-
212
-
213
-
214
-
215
-
216
-
217
-
218
-
219
-
220
-
221
-
222
-
223
-
224
-
225
-
226
-
227
 |
 |

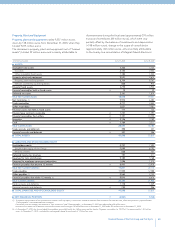
disposals and non-monetary costs and revenues deriving from
the writedowns of fixed assets and deferred tax liabilities,
totaled a positive 286 million euros (negative 706 million euros
in 2003).
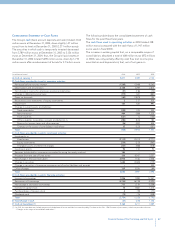
Investment activities generated positive cash flow of 3,045
million euros in 2004, compared with 2,897 million euros in 2003.
Net of the change in marketable securities (which largely
represent short-term investment of liquid funds), investment
activities generated a total of 1,361 million euros, compared
with the 5,962 million euros in 2003, which had benefited from
the flows generated by disposals of assets.
The net reduction in financial receivables, which partially reflects
the decrease in financing extended by the financial services
activities, and receivables from others owed to the industrial
companies, generated 2,976 million euros in available funds
(1,146 million euros generated in 2003).
The principal applications during the year consisted of:
■investments in property, plant and equipment of 2,112 million
euros (2,011 million euros in 2003), including 408 million euros
in investments in vehicles to be leased on a long-term basis
(358 million euros in 2003);
■investments in intangible fixed assets of 237 million euros
(488 million euros in 2003).
In fiscal 2004, the proceed resulting from the disposal of fixed
assets, dividends received by BUC – Banca Unione di Credito,
which was accounted for using the equity method, net of
expenses for the purchase of investments, generated 303 million
euros in available funds, while fiscal 2003 had benefited from
net proceeds of 3,995 million euros from the disposal of assets,
in addition to the collection of receivables paid back by the
sold companies.
Financing activities absorbed 2,734 million euros in 2004,
compared with 1,228 million euros absorbed in 2003.
In 2004, a total of 4,704 million euros in financing was
reimbursed. Net of new financing, including short-term loans
for 713 million euros (1,134 million euros in 2003),
reimbursements totaled 2,735 million euros (3,055 million euros
in 2003) and refer, among others, to the repayment of bonds of
approximately 1 billion euros issued by Fiat Finance & Trade and
the bond exchangeable for General Motors shares of 2.2 billion
dollars (equal to approximately 1.8 billion euros).
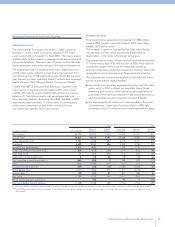
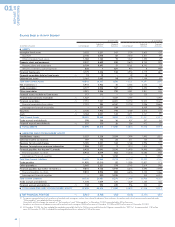
FINANCIAL REVIEW BY ACTIVITY SEGMENT
The following analyses of the statement of operations and the
balance sheet illustrate the performance of the Group, broken
down according to “Industrial Activities” and “Financial
Activities”. Financial Activities include – for Fiat Auto, CNH
and Iveco – the companies that provide financing (to retail
customers, dealers and, to a lower extent, to suppliers)
and leasing and rental services, as described more in detail
in the reports on the operating performance of the Sectors.
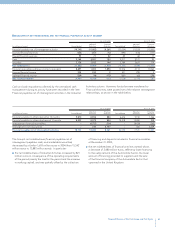
Principles of Analysis
The classification between Industrial and Financial Activities
was realized by defining specific sub-consolidated financial
statements according to the normal business performed by
each Group company.
The equity investments held by companies belonging to an
activity segment in companies included in another segment
were accounted for using the equity method.
To avoid skewing the operating result of normal operations
to be represented here, the effect of this valuation on the
statement of operations is illustrated under the item “Result
of intersegment equity investments.”
The holding companies (Fiat S.p.A., IHF-Internazionale Holding
Fiat S.A., Fiat Partecipazioni S.p.A., Fiat Netherlands Holding
N.V.) were classified under Industrial Activities.
The sub-consolidated financial statements of the Industrial
Activity segment also includes companies that operate
centralized cash management activities, i.e. that raise financial
resources on the market and finance Group companies, without
providing financial services to others.
The transactions relating to the sale of receivables carried
out at market conditions between the industrial and financial
companies of the Group are posted as financial receivables
and payables in the balance sheet of Financial Activities. For
the purposes of this breakdown the portion of these items that,
according to the last contractual relationship established with
others, is still of a commercial nature, insofar as it does not bear
interest, was reclassified directly in the sub-consolidated results
of Financial Activities under trade receivables and payables.
REPORT ON
OPERATIONS
01
38