Chrysler 2004 Annual Report Download - page 42
Download and view the complete annual report
Please find page 42 of the 2004 Chrysler annual report below. You can navigate through the pages in the report by either clicking on the pages listed below, or by using the keyword search tool below to find specific information within the annual report.-
 1
1 -
2
-
3
-
4
-
5
-
6
-
7
-
8
-
9
-
10
-
11
-
12
-
13
-
14
-
15
-
16
-
17
-
18
-
19
-
20
-
21
-
22
-
23
-
24
-
25
-
26
-
27
-
28
-
29
-
30
-
31
-
 32
32 -
 33
33 -
 34
34 -
 35
35 -
 36
36 -
 37
37 -
 38
38 -
 39
39 -
 40
40 -
 41
41 -
 42
42 -
 43
43 -
 44
44 -
 45
45 -
 46
46 -
 47
47 -
 48
48 -
 49
49 -
 50
50 -
 51
51 -
 52
52 -
53
-
54
-
55
-
56
-
57
-
58
-
59
-
60
-
61
-
62
-
63
-
64
-
65
-
66
-
67
-
68
-
69
-
70
-
71
-
72
-
73
-
74
-
75
-
76
-
77
-
78
-
79
-
80
-
81
-
82
-
83
-
84
-
85
-
86
-
87
-
88
-
89
-
90
-
91
-
92
-
93
-
94
-
95
-
96
-
97
-
98
-
99
-
100
-
101
-
102
-
103
-
104
-
105
-
106
-
107
-
108
-
109
-
110
-
111
-
112
-
113
-
114
-
115
-
116
-
117
-
118
-
119
-
120
-
121
-
122
-
123
-
124
-
125
-
126
-
127
-
128
-
129
-
130
-
131
-
132
-
133
-
134
-
135
-
136
-
137
-
138
-
139
-
140
-
141
-
142
-
143
-
144
-
145
-
146
-
147
-
148
-
149
-
150
-
151
-
152
-
153
-
154
-
155
-
156
-
157
-
158
-
159
-
160
-
161
-
162
-
163
-
164
-
165
-
166
-
167
-
168
-
169
-
170
-
171
-
172
-
173
-
174
-
175
-
176
-
177
-
178
-
179
-
180
-
181
-
182
-
183
-
184
-
185
-
186
-
187
-
188
-
189
-
190
-
191
-
192
-
193
-
194
-
195
-
196
-
197
-
198
-
199
-
200
-
201
-
202
-
203
-
204
-
205
-
206
-
207
-
208
-
209
-
210
-
211
-
212
-
213
-
214
-
215
-
216
-
217
-
218
-
219
-
220
-
221
-
222
-
223
-
224
-
225
-
226
-
227
 |
 |

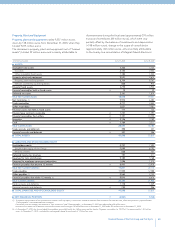
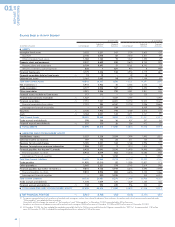
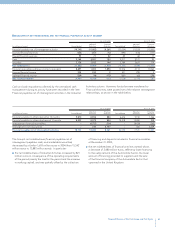
BALANCE SHEET BY ACTIVITY SEGMENT
At 12.31.2004 At 12.31.2003
Industrial Financial Industrial Financial
(in millions of euros) Consolidated Activities Activities Consolidated Activities Activities
■ASSETS
Intangible fixed assets 3,322 3,221 101 3,724 3,600 124
Goodwill 2,140 2,058 82 2,402 2,307 95
Other intangible fixed assets 1,182 1,163 19 1,322 1,293 29
Property, plant and equipment 9,537 8,699 838 9,675 8,750 925
Property, plant and equipment 8,709 8,692 17 8,761 8,742 19
Vehicles covered by operating leases 828 7 821 914 8 906
Financial fixed assets 3,779 5,336 518 3,950 5,119 681
Financial receivables held as fixed assets (*) 19 19 – 29 28 1
Deferred tax assets 2,161 2,062 99 1,879 1,794 85
Total Non-Current Assets 18,818 19,337 1,556 19,257 19,291 1,816
Net inventories (1) 5,972 5,942 30 6,484 6,450 34
Trade receivables 4,777 4,546 587 4,553 4,294 531
Other receivables 3,021 2,246 792 3,081 2,801 476
Financial assets not held as fixed assets 117 117 – 120 120 –
Finance lease contracts receivable (*) 1,727 – 1,727 1,797 – 1,797
Financial receivables (*) 7,151 7,741 6,401 10,750 10,545 9,024
Financial receivables from others 7,151 984 6,167 10,750 2,086 8,664
Intersegment financial receivables – 6,757 234 – 8,459 360
Securities (*) 2,126 1,932 194 3,789 3,670 119
Cash (*) 3,164 3,021 143 3,211 3,121 90
Total Current Assets 28,055 25,545 9,874 33,785 31,001 12,071
Trade accruals and deferrals 398 364 36 407 347 64
Financial accruals and deferrals (*) 327 370 26 386 417 22
■TOTAL ASSETS 47,598 45,616 11,492 53,835 51,056 13,973
■LIABILITIES AND STOCKHOLDERS’ EQUITY
Stockholders’ equity 5,757 5,758 2,074 7,494 7,493 1,851
Deferred income tax reserves 197 173 24 211 135 76
Reserves for risks and charges 5,185 5,021 164 5,168 4,996 172
Reserves for employee severance indemnities 1,286 1,277 9 1,313 1,304 9
Financial payables due beyond 12 months (*) 8,933 8,093 2,576 15,418 14,495 2,885
Financial payables to others 8,933 8,079 854 15,418 14,480 938
Intersegment financial payables – 14 1,722 – 15 1,947
Total Non-Current Liabilities 15,601 14,564 2,773 22,110 20,930 3,142
Trade payables 11,955 12,210 82 12,588 12,827 113
Other payables (1) 2,565 2,327 274 2,742 2,614 246
Financial payables due within 12 months (2) (*) 9,810 9,146 5,919 6,616 5,495 7,978
Financial payables to others 9,810 8,926 884 6,616 5,150 1,466
Intersegment financial payables – 220 5,035 – 345 6,512
Total Current Liabilities 24,330 23,683 6,275 21,946 20,936 8,337
Trade accruals and deferrals 1,178 1,059 121 1,329 1,165 166
Financial accruals and deferrals (*) 732 552 249 956 532 477
■TOTAL LIABILITIES AND STOCKHOLDERS’ EQUITY 47,598 45,616 11,492 53,835 51,056 13,973
■NET FINANCIAL POSITION (*) (4,961)(4,708)(253) (3,028) (2,741) (287)
(1) To improve representation of net inventories of contract work in progress, certain items related to advances from customers for contract work, which were previously reported under
“Other payables” were deducted from inventories.
Consistently with this change, the amounts of “Net inventories” and “Other payables,” at December 31, 2003 were adjusted by 428 million euros.
Inventories are shown net of advances received for contract work in progress (9,645 million euros at December 31, 2004 and 8,876 million euros at December 31, 2003).
(2) At December 31, 2004, the item included the mandatory convertible facility for 3 billion euros and the loan by Citigroup, secured by the “EDF Put”, for approximately 1,150 million
euros. At December 31, 2003, it included the exchangeable bond for an amount of 1,765 million euros.
REPORT ON
OPERATIONS
01
40