Chrysler 2004 Annual Report Download - page 137
Download and view the complete annual report
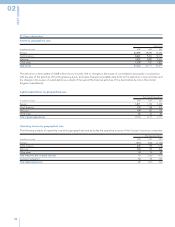
Please find page 137 of the 2004 Chrysler annual report below. You can navigate through the pages in the report by either clicking on the pages listed below, or by using the keyword search tool below to find specific information within the annual report.-
 1
1 -
2
-
3
-
4
-
5
-
6
-
7
-
8
-
9
-
10
-
11
-
12
-
13
-
14
-
15
-
16
-
17
-
18
-
19
-
20
-
21
-
22
-
23
-
24
-
25
-
26
-
27
-
28
-
29
-
30
-
31
-
32
-
33
-
34
-
35
-
36
-
37
-
38
-
39
-
40
-
41
-
42
-
43
-
44
-
45
-
46
-
47
-
48
-
49
-
50
-
51
-
52
-
53
-
54
-
55
-
56
-
57
-
58
-
59
-
60
-
61
-
62
-
63
-
64
-
65
-
66
-
67
-
68
-
69
-
70
-
71
-
72
-
73
-
74
-
75
-
76
-
77
-
78
-
79
-
80
-
81
-
82
-
83
-
84
-
85
-
86
-
87
-
88
-
89
-
90
-
91
-
92
-
93
-
94
-
95
-
96
-
97
-
98
-
99
-
100
-
101
-
102
-
103
-
104
-
105
-
106
-
107
-
108
-
109
-
110
-
111
-
112
-
113
-
114
-
115
-
116
-
117
-
118
-
119
-
120
-
121
-
122
-
123
-
124
-
125
-
126
-
 127
127 -
 128
128 -
 129
129 -
 130
130 -
 131
131 -
 132
132 -
 133
133 -
 134
134 -
 135
135 -
 136
136 -
 137
137 -
 138
138 -
 139
139 -
 140
140 -
 141
141 -
 142
142 -
 143
143 -
 144
144 -
 145
145 -
 146
146 -
 147
147 -
148
-
149
-
150
-
151
-
152
-
153
-
154
-
155
-
156
-
157
-
158
-
159
-
160
-
161
-
162
-
163
-
164
-
165
-
166
-
167
-
168
-
169
-
170
-
171
-
172
-
173
-
174
-
175
-
176
-
177
-
178
-
179
-
180
-
181
-
182
-
183
-
184
-
185
-
186
-
187
-
188
-
189
-
190
-
191
-
192
-
193
-
194
-
195
-
196
-
197
-
198
-
199
-
200
-
201
-
202
-
203
-
204
-
205
-
206
-
207
-
208
-
209
-
210
-
211
-
212
-
213
-
214
-
215
-
216
-
217
-
218
-
219
-
220
-
221
-
222
-
223
-
224
-
225
-
226
-
227
 |
 |

135
Consolidated Financial Statements at December 31, 2004 – Notes to the Consolidated Financial Statements
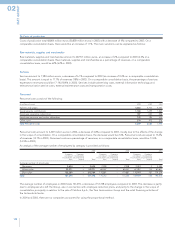
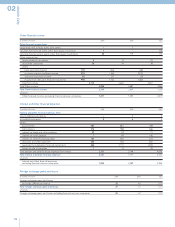
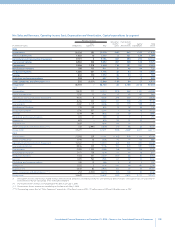
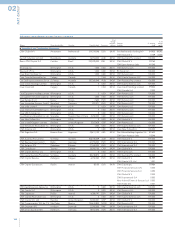
Net Sales and Revenues, Operating income (loss), Depreciation and Amortization, Capital expenditures by segment
Net sales revenues Operating Depreciation
Inter-
Income and Capital Total
(in millions of euros) Third parties
segment (*)
Total (Loss) Amortization expenditures Assets
2004
Automobiles 20,356 183 20,539 (840)945 1,330 17,839
Ferrari and Maserati 1,502 10 1,512 6 121 139 1,099
Agricultural and Construction Equipment 9,791 5 9,796 407 393 210 12,134
Commercial Vehicles 8,960 332 9,292 357 308 148 9,505
Components 2,586 1,218 3,804 116 181 187 2,393
Metallurgical Products 798 113 911 35 48 44 728
Production Systems 1,285 431 1,716 32 43 14 3,560
Services 802 770 1,572 36 33 11 783
Publishing and communications 398 9 407 12 7 2 228
Other companies and eliminations (****) 225 (3,071)(2,846)(139)89 27 8,974
Group total 46,703 – 46,703 22 2,168 2,112 57,243
2003
Automobiles 19,839 171 20,010 (979) 962 1,100 20,908
Ferrari and Maserati 1,250 11 1,261 32 85 193 965
Agricultural and Construction Equipment 9,410 8 9,418 229 450 217 12,928
Commercial Vehicles 8,206 234 8,440 81 304 210 9,108
Components 2,087 1,119 3,206 32 173 148 2,418
Metallurgical Products 735 109 844 12 49 56 739
Production Systems 1,756 537 2,293 2 56 18 4,125
Services 1,019 797 1,816 45 30 7 1,892
Publishing and communications 372 11 383 10 7 3 251
Aviation (**) 625 – 625 53 41 33 –
Insurance (***) 1,654 – 1,654 44 16 – –
Other companies and eliminations (****) 318 (2,997) (2,679) (71) 96 26 9,377
Group total 47,271 – 47,271 (510) 2,269 2,011 62,711
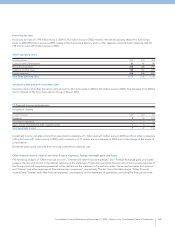
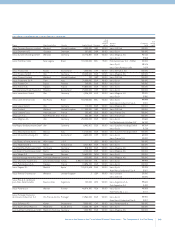
2002
Automobiles 21,908 239 22,147 (1,343) 959 1,116 30,026
Ferrari and Maserati 1,194 14 1,208 70 77 176 897
Agricultural and Construction Equipment 10,502 11 10,513 163 541 431 14,434
Commercial Vehicles 8,816 320 9,136 102 424 587 10,846
Components 2,085 1,203 3,288 (16) 190 148 2,752
Metallurgical Products 1,411 128 1,539 27 93 78 857
Production Systems 1,763 557 2,320 (101) 64 20 4,763
Services 1,005 960 1,965 67 42 14 3,306
Publishing and communications 346 14 360 3 8 3 227
Aviation (**) 1,532 2 1,534 210 69 130 3,206
Insurance (***) 4,834 82 4,916 147 47 14 19,041
Other companies and eliminations (****) 253 (3,530) (3,277) (91) 100 54 2,166
Group total 55,649 – 55,649 (762) 2,614 2,771 92,521
(*) Intersegment net sales and revenues include revenues between Group companies consolidated line-by-line and reporting to different Sectors. Intersegment sales are accounted for
at transfer prices that are substantially in line with market conditions.
(**) The Aviation Sector’s revenues are included up to the date of sale (July 1, 2003).
(***) The Insurance Sector’s revenues are included up to the date of sale (May 2, 2003).
(****) The operating income (loss) of “Other Companies” amounts to -120 million of euros in 2004, -137 million euros in 2003 and -105 million euros in 2002.