Chrysler 2004 Annual Report Download - page 30
Download and view the complete annual report
Please find page 30 of the 2004 Chrysler annual report below. You can navigate through the pages in the report by either clicking on the pages listed below, or by using the keyword search tool below to find specific information within the annual report.-
 1
1 -
2
-
3
-
4
-
5
-
6
-
7
-
8
-
9
-
10
-
11
-
12
-
13
-
14
-
15
-
16
-
17
-
18
-
19
-
 20
20 -
 21
21 -
 22
22 -
 23
23 -
 24
24 -
 25
25 -
 26
26 -
 27
27 -
 28
28 -
 29
29 -
 30
30 -
 31
31 -
 32
32 -
 33
33 -
 34
34 -
 35
35 -
 36
36 -
 37
37 -
 38
38 -
 39
39 -
 40
40 -
41
-
42
-
43
-
44
-
45
-
46
-
47
-
48
-
49
-
50
-
51
-
52
-
53
-
54
-
55
-
56
-
57
-
58
-
59
-
60
-
61
-
62
-
63
-
64
-
65
-
66
-
67
-
68
-
69
-
70
-
71
-
72
-
73
-
74
-
75
-
76
-
77
-
78
-
79
-
80
-
81
-
82
-
83
-
84
-
85
-
86
-
87
-
88
-
89
-
90
-
91
-
92
-
93
-
94
-
95
-
96
-
97
-
98
-
99
-
100
-
101
-
102
-
103
-
104
-
105
-
106
-
107
-
108
-
109
-
110
-
111
-
112
-
113
-
114
-
115
-
116
-
117
-
118
-
119
-
120
-
121
-
122
-
123
-
124
-
125
-
126
-
127
-
128
-
129
-
130
-
131
-
132
-
133
-
134
-
135
-
136
-
137
-
138
-
139
-
140
-
141
-
142
-
143
-
144
-
145
-
146
-
147
-
148
-
149
-
150
-
151
-
152
-
153
-
154
-
155
-
156
-
157
-
158
-
159
-
160
-
161
-
162
-
163
-
164
-
165
-
166
-
167
-
168
-
169
-
170
-
171
-
172
-
173
-
174
-
175
-
176
-
177
-
178
-
179
-
180
-
181
-
182
-
183
-
184
-
185
-
186
-
187
-
188
-
189
-
190
-
191
-
192
-
193
-
194
-
195
-
196
-
197
-
198
-
199
-
200
-
201
-
202
-
203
-
204
-
205
-
206
-
207
-
208
-
209
-
210
-
211
-
212
-
213
-
214
-
215
-
216
-
217
-
218
-
219
-
220
-
221
-
222
-
223
-
224
-
225
-
226
-
227
 |
 |

REPORT ON
OPERATIONS
01
28
Net Revenues
Fiat Group net revenues, including changes in contract work
in progress, totaled 46,703 million euros, reflecting a 1.2%
decrease from the previous year, largely due to the disposal
of activities. If only Continuing Operations in 2003 are
considered – excluding the revenues of sold businesses –
there was an increase of 5% in consequence of higher volumes
of activity at most Sectors. This positive effect was partially
reduced, especially at CNH, by the negative foreign exchange
effect due to the weakening of the dollar.
Revenues broken down by Sector are illustrated below:
■Fiat Auto reported revenues of 20,539 million euros for
2004, up 5.5% from the 19,477 million euros for Continuing
Operations in 2003, mainly due to higher sales volumes.
Fiat Auto sold a total of approximately 1,766,000 automobiles
and commercial vehicles, up 4.2% from 2003.
In Western Europe, 1,193,000 vehicles were sold, 1.2%
more than in the previous year. Most of the increase in sales
volumes occurred in Italy (+4.9%), thanks to the success of
new models, while volumes contracted on the other principal
markets of Western Europe, with decreases of 8.9% in France,
9.1% in Germany, and 6.1% in Great Britain.
Outside of Western Europe, sales volumes expanded strongly
in Brazil (+12.7%), stimulated by the recovery in demand
and introduction of new models. On the other hand, sales
decreased by 13.8% in Poland due to lower local market
demand with respect to 2003.
■Ferrari – Maserati reported revenues of 1,512 million euros,
up by 20% from the previous year notwithstanding the
negative foreign exchange effect. The improvement is partly
attributable to higher Maserati sales, driven by the success
of the Quattroporte model and higher volumes for Ferrari,
thanks to the positive contribution made by the 612 Scaglietti
and Challenge highway models, as well as the introduction
in the fourth quarter of the new F430, successor to the 360
Modena model.
■In 2004 CNH posted revenues of 9,796 million euros. The
increase from the 9,418 million euros reported for fiscal 2003
(+4%) was limited by the negative foreign exchange effect
provoked by appreciation of the euro against the dollar.
When expressed in dollars, the functional currency of this
Sector, and net of the foreign exchange effect, the increase
was approximately 9%. The increase is attributable to strong
sales performance of both agricultural and construction
equipment, particularly in the Americas, and higher prices.
Revenues rose in the agricultural equipment segment thanks to
the strong increase in tractor sales in North America, as well as
the positive sales performance reported in Latin America and
other countries worldwide. On the other hand, sales declined
in Western Europe with respect to 2003 due to feeble growth in
the market for tractors and lower demand for combine harvesters.
Construction equipment sales revenues improved markedly
thanks to the major growth in volumes of all principal product
lines. The overall increase in units sold was consistent with the
growth that took place in the global market.
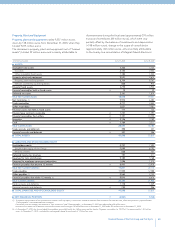
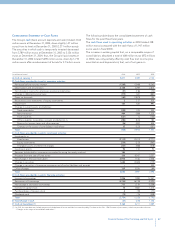
2004 2003
Continuing
(in millions of euros) Consolidated Operations Consolidated
Net revenues 46,703 44,498 47,271
Cost of sales 39,623 38,468 40,830
Gross operating result 7,080 6,030 6,441
Overhead 4,629 4,509 4,748
Research and Development 1,810 1,724 1,747
Other operating income (expenses) (619) (511) (456)
Operating result 22 (714) (510)
Investment income (expenses) (*) 8(79) (156)
Non-operating income (expenses) (**) (863) 359 347
EBIT (833) (434) (319)
Financial income (expenses) (744) (1,067) (979)
Result before taxes (1,577) (1,501) (1,298)
Income taxes (29) 541 650
Net result (1,548) (2,042) (1,948)
Net result of Discontinued Operations –90 –
Net result before minority interest (1,548) (1,952) (1,948)
Group interest in net result (1,586) (1,900)
(*) This item includes investment income (expenses) as well as write-downs and write-ups due to adjustments in equity investments accounted for using the equity method.
(**) The 2003 figure of Continuing Operations includes 1,742 million euros in net gains on the disposal of Discontinuing Operations.