Chrysler 2004 Annual Report Download - page 70
Download and view the complete annual report
Please find page 70 of the 2004 Chrysler annual report below. You can navigate through the pages in the report by either clicking on the pages listed below, or by using the keyword search tool below to find specific information within the annual report.-
 1
1 -
2
-
3
-
4
-
5
-
6
-
7
-
8
-
9
-
10
-
11
-
12
-
13
-
14
-
15
-
16
-
17
-
18
-
19
-
20
-
21
-
22
-
23
-
24
-
25
-
26
-
27
-
28
-
29
-
30
-
31
-
32
-
33
-
34
-
35
-
36
-
37
-
38
-
39
-
40
-
41
-
42
-
43
-
44
-
45
-
46
-
47
-
48
-
49
-
50
-
51
-
52
-
53
-
54
-
55
-
56
-
57
-
58
-
59
-
 60
60 -
 61
61 -
 62
62 -
 63
63 -
 64
64 -
 65
65 -
 66
66 -
 67
67 -
 68
68 -
 69
69 -
 70
70 -
 71
71 -
 72
72 -
 73
73 -
 74
74 -
 75
75 -
 76
76 -
 77
77 -
 78
78 -
 79
79 -
 80
80 -
81
-
82
-
83
-
84
-
85
-
86
-
87
-
88
-
89
-
90
-
91
-
92
-
93
-
94
-
95
-
96
-
97
-
98
-
99
-
100
-
101
-
102
-
103
-
104
-
105
-
106
-
107
-
108
-
109
-
110
-
111
-
112
-
113
-
114
-
115
-
116
-
117
-
118
-
119
-
120
-
121
-
122
-
123
-
124
-
125
-
126
-
127
-
128
-
129
-
130
-
131
-
132
-
133
-
134
-
135
-
136
-
137
-
138
-
139
-
140
-
141
-
142
-
143
-
144
-
145
-
146
-
147
-
148
-
149
-
150
-
151
-
152
-
153
-
154
-
155
-
156
-
157
-
158
-
159
-
160
-
161
-
162
-
163
-
164
-
165
-
166
-
167
-
168
-
169
-
170
-
171
-
172
-
173
-
174
-
175
-
176
-
177
-
178
-
179
-
180
-
181
-
182
-
183
-
184
-
185
-
186
-
187
-
188
-
189
-
190
-
191
-
192
-
193
-
194
-
195
-
196
-
197
-
198
-
199
-
200
-
201
-
202
-
203
-
204
-
205
-
206
-
207
-
208
-
209
-
210
-
211
-
212
-
213
-
214
-
215
-
216
-
217
-
218
-
219
-
220
-
221
-
222
-
223
-
224
-
225
-
226
-
227
 |
 |

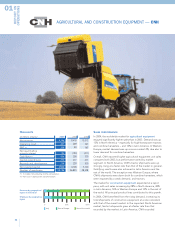
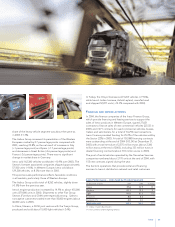
by the negative impact of the appreciation of the euro versus
the U.S. dollar. If the currency translation effect is eliminated
by comparing figures stated in constant U.S. dollars (the Sector’s
reporting currency), revenues show a gain of 9%. This
improvement reflects higher sales both in agricultural machines
and, to an even more pronounced degree, construction
equipment on a worldwide basis and in particular in the
Americas, and increased sales prices.
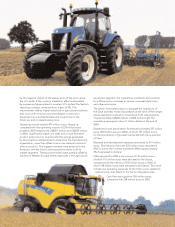
Operating income totaled 407 million euros, sharply up
compared with the operating income of 229 million euros
posted in 2003 (respectively US$507 million and US$259 million
in 2003). Significantly higher unit sales and a more favorable
product and price mix, coupled with the savings generated
by the programs implemented to streamline the manufacturing
organization, more than offset a rise in raw material costs and
other economics. The biggest increases were achieved in the
Americas, with the Sector posting positive results in all its
market segments. These positive results were partially offset by
declines in Western Europe where, especially in the agricultural
equipment segment, the competitive conditions did not allow
for sufficient price increases to recover increased steel costs
and other economics.
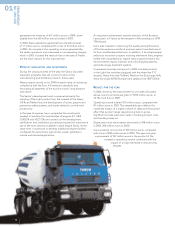
The Sector formulated a plan to integrate the operations of
the Case and New Holland businesses at the time of the merger
whose realization resulted in incremental profit improvements
of approximately US$200 million in 2004 and brought the
cumulative synergies to about 1 billion dollars at the end of
2004.
Depreciation and amortization for the period totaled 393 million
euros (450 million euros in 2003), of which 127 million euros
for the amortization of goodwill connected with the acquisition
of Case.
Research and development expenses amounted to 214 million
euros. The reduction from the 229 million euros recorded in
2003 is due to the currency translation effect (approximately
3% if expressed in dollars).
CNH reported for 2004 a net income of 133 million euros,
of which 115 million euros were allocated to the Sector,
compared with the net loss of 192 million euros in 2003, of
which 198 million euros were allocated to the Sector. This result
include non-operating expenses for 65 million euros related to
restructuring costs linked to the Sector integration plan.
Cash flow was a positive 526 million euros,
compared with 258 million euros in 2003.